Figure 3.
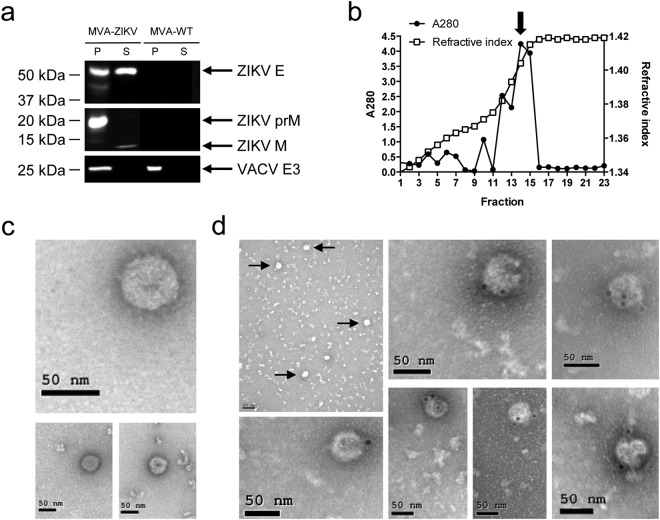
MVA-ZIKV produced VLPs. (a) Western blot analysis of the ZIKV proteins detected in cells extracts (P) or in supernatants (S) concentrated through a 20% sucrose cushion and derived from HeLa cells infected with MVA-ZIKV or MVA-WT. Arrows on the right indicate the positions of the ZIKV prM, M and E proteins. The sizes of standards (in kDa) are indicated on the left. (b) Amount of protein and sucrose density in fractions obtained after ultracentrifugation of MVA-ZIKV-concentrated supernatants loaded into a 20–60% w/v sucrose gradient. The amount of protein in each fraction was determined by spectrophotometry measuring the absorbance at 280 nm (A280). The sucrose density in each fraction was determined by refractometry. Arrow indicates the fraction (14) analyzed by electron microscopy. (c,d) Detection by electron microscopy of VLPs produced by MVA-ZIKV. Negative-stained (c) or anti-ZIKV E immunogold-stained (d) transmission electron microscopy images of purified ZIKV VLPs contained in the fraction 14 of the MVA-ZIKV gradient shown in (b). Arrows indicate the VLPs detected in a lower magnification image of the anti-ZIKV E immunogold-stained assay. Scale bars: 50 nm or 100 nm.

