Figure 5.
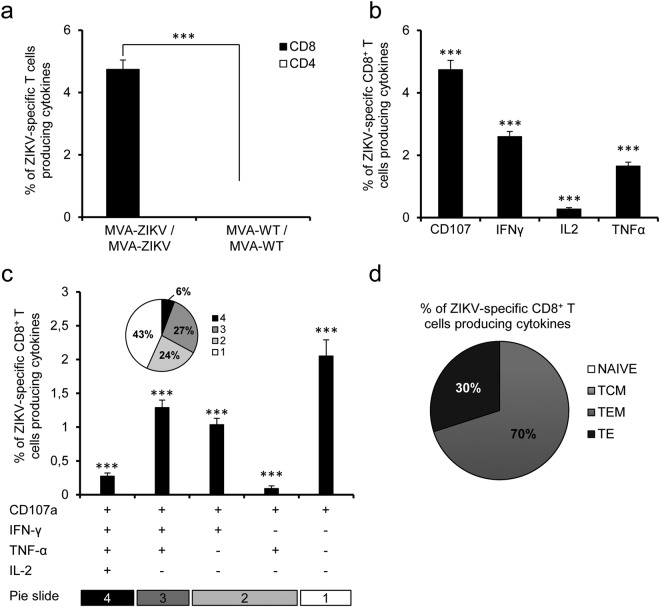
MVA-ZIKV induced potent CD8+ T cell responses in mice. Balb/c mice were immunized as in Fig. 4. P values indicate significantly higher responses in comparison of MVA-ZIKV/MVA-ZIKV to MVA-WT/MVA-WT (***P < 0.001). (a) Overall magnitude of ZIKV-specific CD4+ and CD8+ T cells. The values represent the sums of the percentages of T cells producing CD107a and/or IFN-γ and/or TNF-α and/or IL-2 against the ZIKV E protein peptide pool. (b) Pattern of ZIKV-specific CD8+ T cell immune responses in MVA-ZIKV-vaccinated mice. Frequencies were calculated by reporting the number of CD8+ T cells producing CD107a or IFN-γ or TNF-α or IL-2. (c) Polyfunctional profile of ZIKV-specific CD8+ T cell immune responses in MVA-ZIKV-vaccinated mice. Those T cell populations with a positive response are shown on the x axis, while the percentages of CD8+ T cells producing CD107a and/or IFN-γ and/or TNF-α and/or IL-2 against the ZIKV E peptide pool are shown on the y axis. Responses are grouped and coded on the basis of the number of functions (4, 3, 2, or 1). The pie charts summarize the data, with each slice corresponding to the proportion of ZIKV-specific CD8+ T cells exhibiting one, two, three, or four functions within the total population of ZIKV-specific CD8+ T cells. (d) Phenotypic profile of ZIKV-specific CD8+ T cells in MVA-ZIKV-vaccinated mice. CD127 and CD62L expression was used to identify naive, TCM, TEM and TE subpopulations. Each slice corresponds to the proportion of each ZIKV-specific CD8+ T cell subpopulations within the total ZIKV-specific CD8+ T cells producing CD107a and/or IFN-γ and/or TNF-α and/or IL-2.

