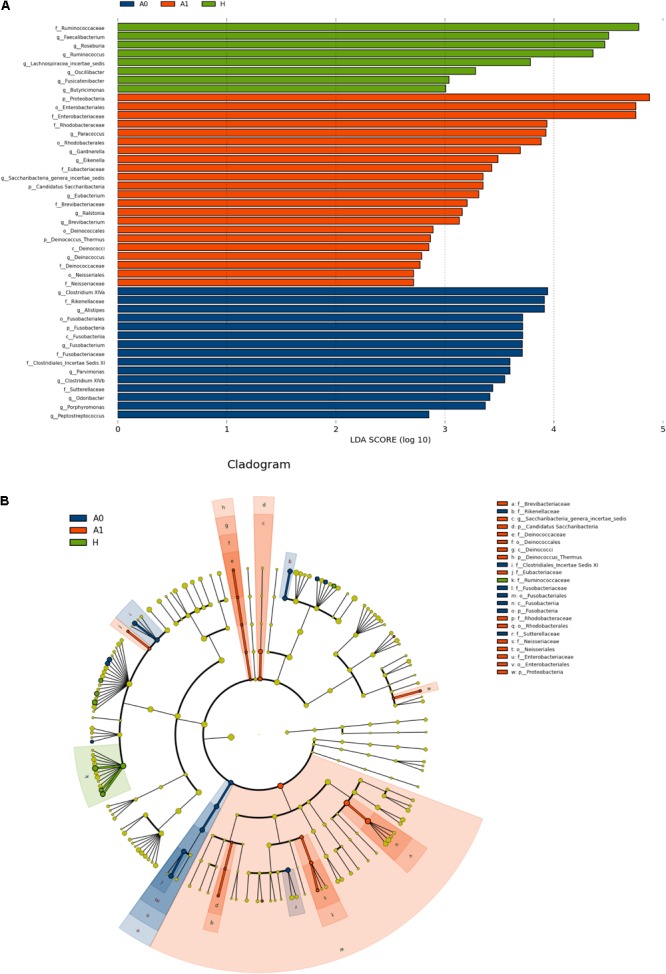
FIGURE 2.

Microbial biomarkers among healthy volunteers (H) and CRC patients (A0 and A1). (A) LEfSe analysis shows differentially abundant taxa as biomarkers using Kruskal–Wallis test (P < 0.05) with LDA score > 2.0. (B) Cladogram representation of the differentially abundant taxa. The root of the cladogram represents the domain bacteria. The size of each node represents their relative abundance. No significantly different taxa are labeled by yellow. Significant different taxa are labeled by following the color of each group.
