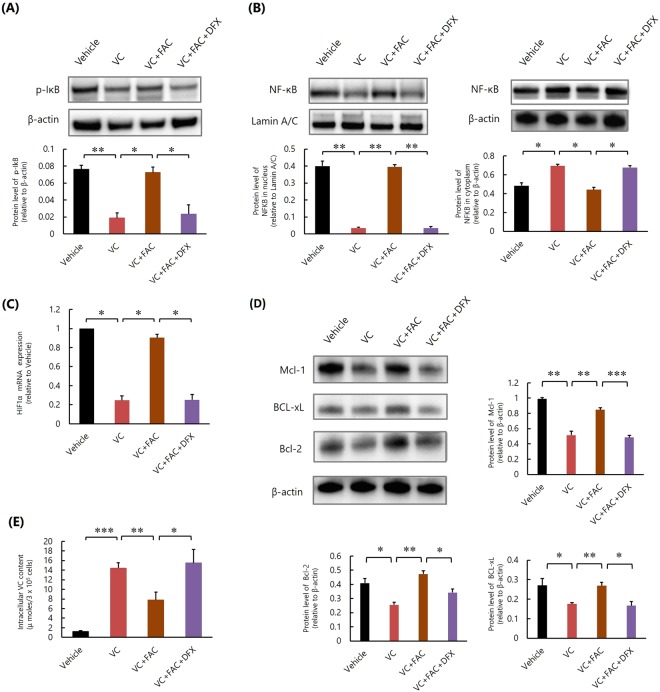
Figure 5.
Iron chelator DFX restores the inhibitory effect of VC against NF-κB activation of K562 cells, increasing the amount of intracellular VC in vitro. (A) Western blot analysis of phosphorylated IκB. *P < 0.01, **P < 0.001. The values represent the mean ± SD values of triplicate samples. (B) Western blot analysis of NF-κB. *P < 0.001, **P < 0.0001. The values represent the mean ± SD values of triplicate samples. (C) Quantitative real-time polymerase chain reaction analysis of HIF-1α mRNA. *P < 0.0001. The values represent the mean ± SD values of triplicate samples. (D) Western blot analyses of Mcl-1, Bcl-xL, and Bcl-2. *P < 0.01, **P < 0.001, ***P < 0.0001. The values represent the mean ± SD values of triplicate samples. (E) Intracellular VC amount. *P < 0.05, **P < 0.01, ***P < 0.0001. The values represent the mean ± SD values of triplicate samples.

