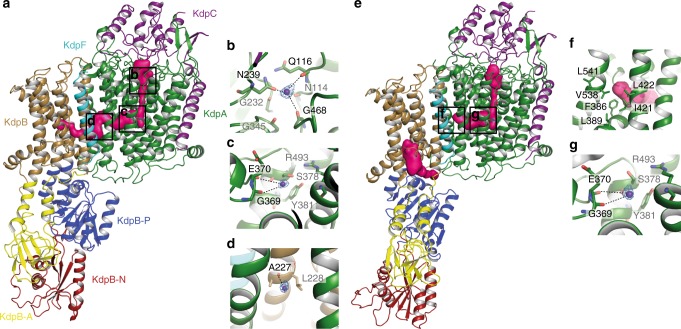
Fig. 3.
Outward-open and inward-open half-channels in states 1 and 2 of KdpFABC. a Entrance tunnel in state 1 covering the selectivity filter and the inter-subunit tunnel between KdpA and KdpB. b–d Magnification of the K+ binding sites inside the entrance tunnel in state 1 shown with corresponding cryo-EM density map for the potassium ions sharpened with b-factors of −205 Å2 at 5.5 σ (b), 6.0 σ (c), and 6.5 σ (d). Coordinating residues are represented as sticks. e Blocked entrance tunnel at the KdpA-KdpB interface and open exit pathway between KdpA and the P domain of KdpB in state 2. f Close-up view of the entrance tunnel blockage in state 2. Tunnel-blocking residues of KdpA are represented as sticks. g Magnification of the K+ binding site inside the residual entrance tunnel in state 2 shown with cryo-EM density map for K+ sharpened with a b-factor of -195 Å2 at 5.5 σ. Coordinating residues represented as sticks. Potassium ions are shown as dark purple spheres. Entrance and exit tunnel surface representations (pink densities) were calculated with Hollow61

