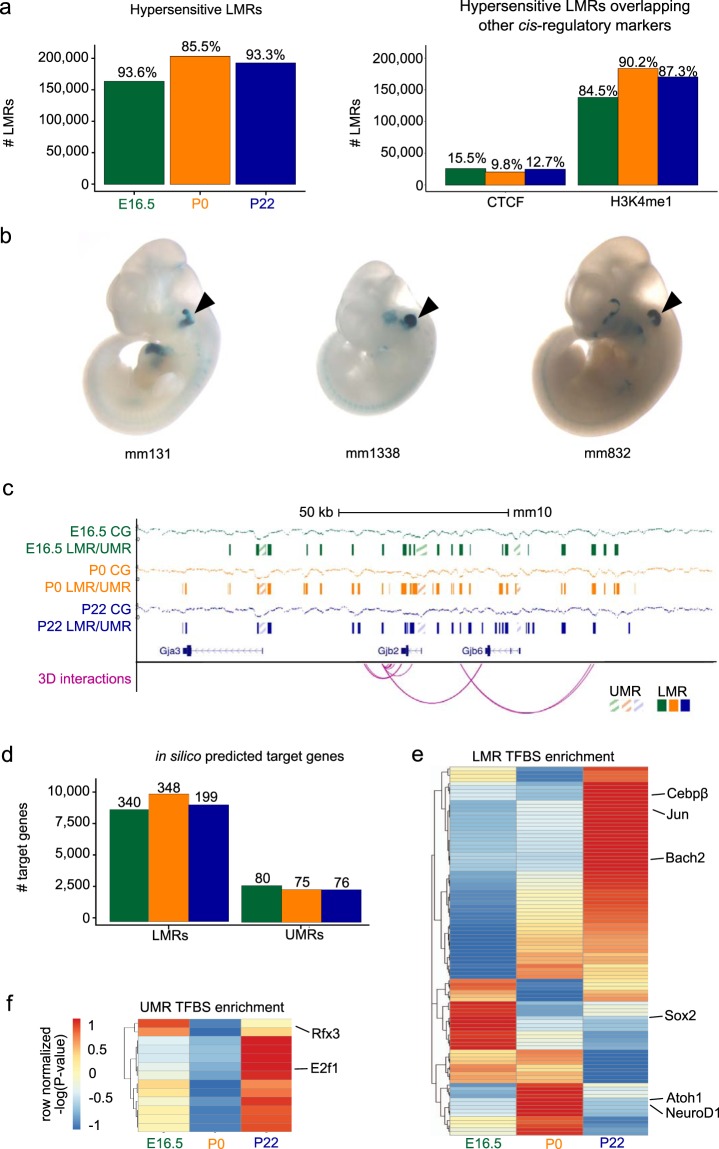
Figure 2.
Putative regulatory landscape of the inner ear SE. (a) Right bar plot shows the number of low-methylated regions (LMRs) overlapping known DNase I Hypersensitive Sites (DHS) from the mouse ENCODE project25. The numbers on each bar represent the percent overlap with respect to all LMRs. Left bar plot shows the number of hypersensitive LMRs that overlap CTCF binding sites and H3K4me1 enhancer peaks. The numbers on each bar denote percent overlaps. (b) Examples of experimentally validated mouse non-coding fragments with otic (ear) enhancer activity as assessed in transgenic mice from Vista Enhancer Browser for which we found an overlap with LMRs at one of the three time points. (c) Browser shot of the Gjb2 gene locus, illustrating percent methylation levels, LMRs, unmethylated regions (UMRs) and their putative interactions with target genes. (d) Bar plot showing the number of putative target genes interacting with LMRs and UMRs. The numbers on each bar denote the count of known deafness target genes. (e, f) Heatmap of row normalized -log(P-value) for the relative enrichment across the three time points for transcription factor (TF) motifs present in LMRs (e) UMRs (f) and filtered for expression. Representative TFs are shown on the side.

