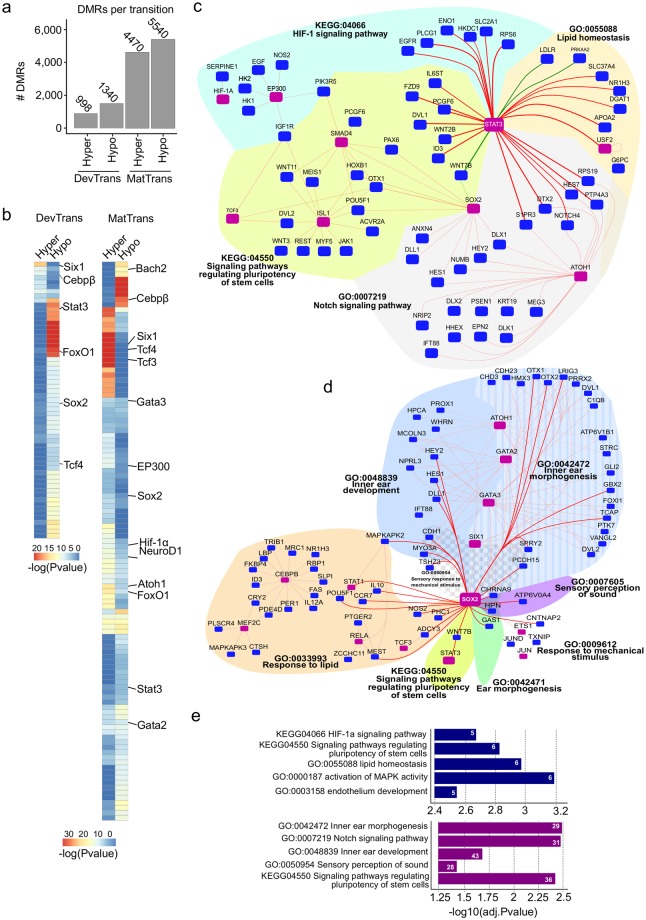
Figure 3.
Methylation dynamics across development and maturation transitions. (a) Bar plot showing the number of hyper- and hypo-differentially methylated regions (DMRs) identified in DevTrans and MatTrans. (b) Heatmap representation of enriched transcription factor binding site (TFBS) motifs in DMRs for each transition. (c, d) In silico transcriptional regulatory networks based on DMR target gene interactions during DevTrans (green connecting line) and MatTrans (red connecting line). Known deafness transcription factors (TFs)/genes are marked by purple squares. TF-target gene interactions are clustered according to common GO terms (indicated by various color and patterned filled areas). Centralized specific TF in silico transcriptional regulatory networks around the hair cell marker, Stat3 (c) or supporting cell marker Sox2 (d). All direct interactions with centralized TFs are indicated by bold lines. (e) The enriched GO biological process terms and pathways for the overall regulatory networks of DevTrans (top) and MatTrans (bottom) (Table S7), number of GO term connected genes are shown in white.

