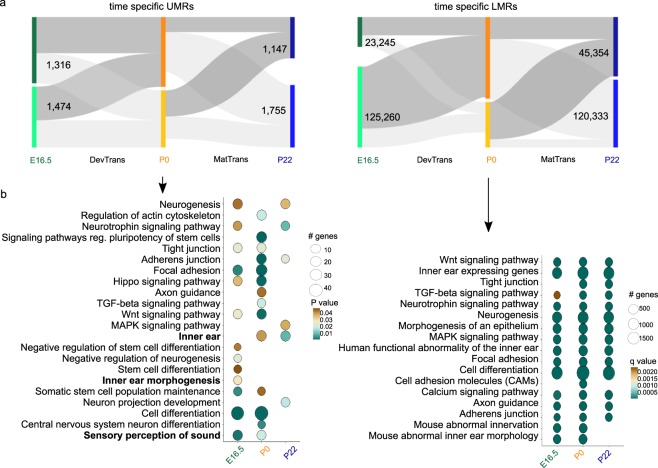
Figure 4.
Analysis of time point-specific unmethylated region (UMR) and low-methylated region (LMR) putative regulatory regions. (a) Time point-specific UMRs (5,692) and LMRs (314,192) and their dynamics through the time points, represented as Sankey plots; regions defined at a specific time point as UMR/LMR (dark grey) and regions not defined as UMR/LMR (light grey). (b) GO term enrichment analysis of time point-specific UMR (top) and time point-specific LMR (bottom) associated genes; for UMR analysis, Circle fill is according to P value (<0.05) and for time point-specific LMR according to q value (FDR < 0.05). Circle diameter is proportional to the number of genes associated with each term.

