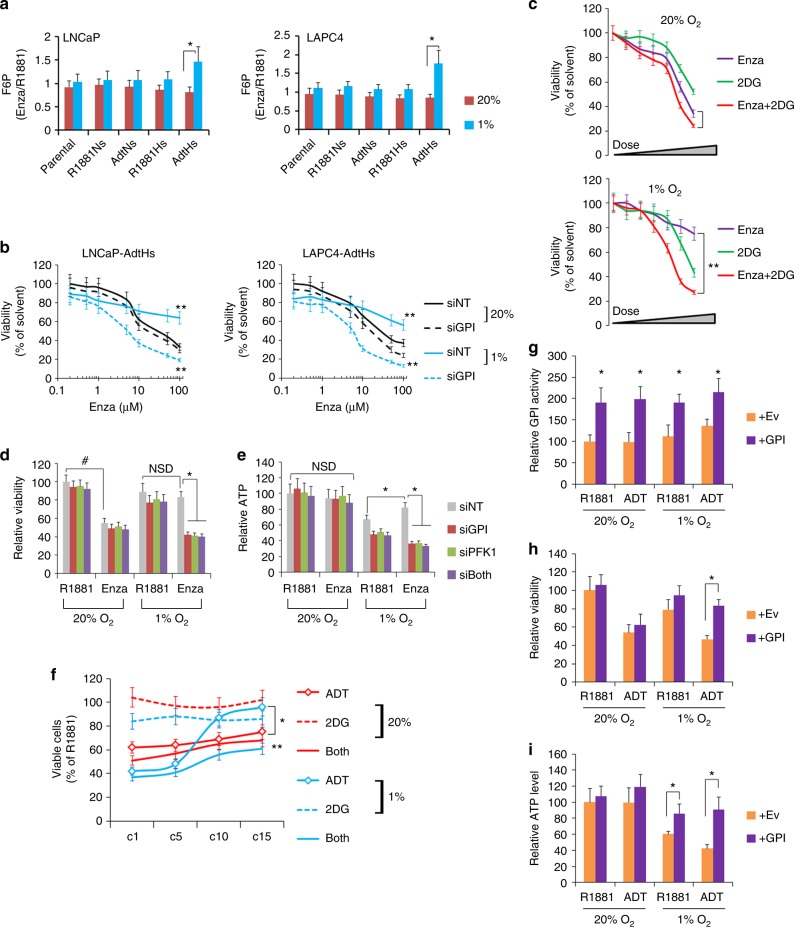
Fig. 6.
GPI reduces the antitumor activity of enzalutamide in hypoxia in vitro. a Relative levels of F6P in cells treated by enzalutamide (Enza) vs solvent control (R1881) in normoxia or hypoxia. Cells were cultured in CSS + 1 nM R1881, and then treated with solvent control or 10 µM enzalutamide in 20% or 1% O2 for 48 h. F6P was measured and expressed as mean ± s.d. relative to R1881 (Enza/R1881), n = 3, *P < 0.05, two-sided t-test. b Dose-dependent inhibition of viability/growth by enzalutamide against AdtHs cells in 20% or 1% O2 with/without GPI-siRNA. LNCaP and LAPC4-AdtHs cells, cultured in CSS media + 1 nM R1881, were transfected with siRNA (siNT or siGPI), and treated with increasing doses of enzalutamide for 96 h in normoxia or hypoxia. Viable cells were determined by SYTO 60. The siNT vs. siGPI in hypoxia are represented by solid vs. dotted blue lines, respectively. All values are mean ± s.d. relative to 0 µM enzalutamide, n = 3, **P < 0.01, two-sided t-test. c Growth/viability of LNCaP-AdtHs cells in normoxia or hypoxia, being treated by increasing doses of enzalutamide, 2DG (0 – 10 mM), or the combination for 96 h. Viable cells were determined by SYTO 60. All values are mean ± s.d. relative to solvent control, n = 3, **P < 0.01, two-sided t-test. d, e LNCaP-AdtHs cells, cultured in CSS media + 1 nM R1881, were transfected with siRNA (siNT, siGPI, siPFK, or siGPI + siPFK), and treated with solvent (R1881) or enzalutamide in normoxia or hypoxia for 96 h. Viable cells were determined by SYTO 60 (d). ATP levels were determined by colorimetric assays (e). All values were mean ± s.d. relative to the siNT-R1881-20% O2 condition, n = 3, *,#P < 0.05, NSD, two-sided t-test and/or repeated measures ANOVA. f Growth/viability of LAPC4 cells during the chronic-treatment with ADT, 2DG or ADT+2DG in normoxia or hypoxia. Throughout the treatment cycle (c1 – c15), LAPC4 cells, cultured in CSS + R1881 media, were treated by negative control (R1881), ADT, 2DG (1 mM), or ADT+2DG in normoxia or hypoxia. Cell growth after cycle 1, 5, 10, and 15 were determined and expressed as mean ± s.d. as % relative to the R1881-normoxia condition, n = 3, *ADT in hypoxia (blue -o- line) vs ADT in normoxia (red -o- line), **ADT in hypoxia (blue -o- line) vs ADT + 2DG (blue solid line) in hypoxia, P < 0.05 two-sided t-test and/or repeated measures ANOVA. g–i LAPC4 cells were transfected with Ev or GPI overexpression plasmids and then cultured with 1 nM R1881 or ADT in normoxia or hypoxia for 72 h. The GPI activity was determined with a kit from BioVision (g), growth/viability was determined with SYTO 60 (h), ATP level was determined with a kit from BioVision (i). All values are mean ± s.d. relative to the Ev-R1881-20% O2 condition, n = 3, *P < 0.05, two-sided t-test

