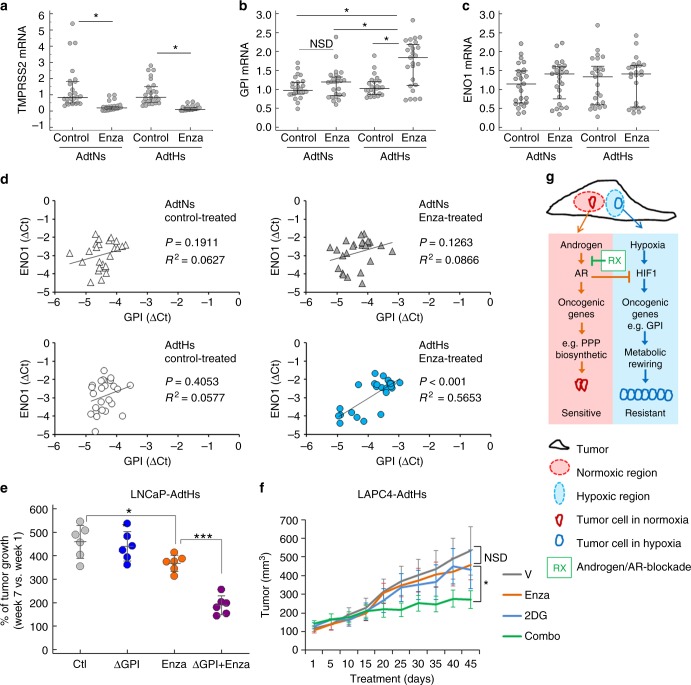
Fig. 7.
GPI reduces the antitumor activity of enzalutamide in vivo. a–c Xenograft tumors from LNCaP AdtNs or AdtHs cells in Fig. 1g were cut into small pieces and used for RNA isolation, cDNA synthesis, and qRT-PCR. On average, 4 different locations (4 pieces) of each tumor were sampled, the sample size for each group (solvent or enzalutamide-treated AdtNs or AdtHs) is 25 (n = 25). The mRNA expression of TMPRSS2 (a), GPI (b), and ENO1 (c) in each tumor piece (dot) is relative to the average of AdtNs tumors from solvent-treated control mice. Median (center line) ± 25 percentile, n = 25, *P< 0.05, two-sided t-test in a or repeated measure ANOVA in b. d The correlation between ENO1 and GPI mRNA expression in each tumor piece, grouped by AdtNs vs. AdtHs and by control-treated vs. enzalutamide. The P-value and R2 were calculated by linear regression, n = 25. e Antitumor effect of enzalutamide in vivo with/without GPI. LNCaP-AdtHs cells with CRISPR/Cas9 knockout of GPI (ΔGPI) or negative control were injected subcutaneously to male nude mice. After the tumors were palpable, mice were treated with vehicle (Ctl) or enzalutamide for 7 weeks. Tumor volume was followed by digital caliper. The % of growth for each tumor (post-treatment/pre-treatment) is shown as mean (center line) ± s.d. n = 6, *P < 0.05, ***P < 0.01, two-sided t-test. f Antitumor effect of enzalutamide in vivo in the presence/absence of glycolysis inhibitor 2DG. LAPC4-AdtHs cells were injected subcutaneously to male nude mice. After the tumors were palpable (~100 mm3), mice were treated with vehicle (V), enzalutamide, 2DG, or enzalutamide + 2DG for 6 weeks. The tumor volume is mean ± s.d. n = 6, *P < 0.05, NSD, two-sided t-test and/or repeated measures ANOVA. g Schematic diagram of the negative regulation of hypoxia/HIF1 gene expression, e.g., GPI, by androgen/AR, leading to hypoxia-induced adaptive resistance to androgen/AR-targeted therapy (conditional androgen/AR-independence and therapy resistance)

