
FIGURE 1.
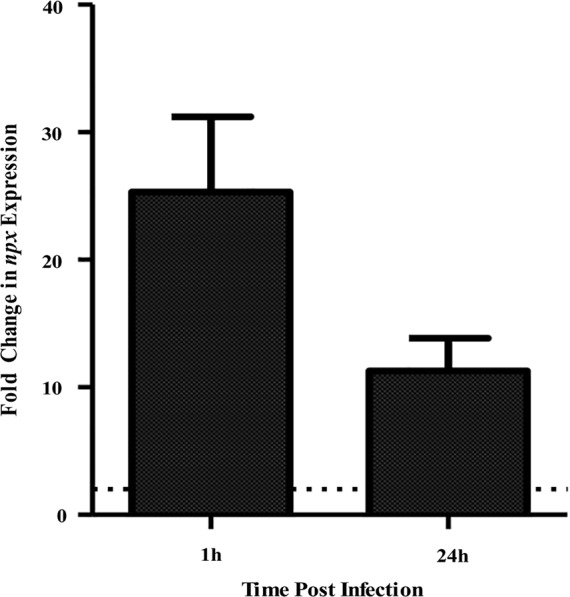
Expression of npx at 1 and 24 h survival inside PMA-treated human macrophages tested using qPCR. Fold change in expression was calculated relative to gene expression during growth in RPMI medium alone for 1 h. Dotted line indicates twofold change in gene expression. Data shown is average ± SD of three separate biological replicates.