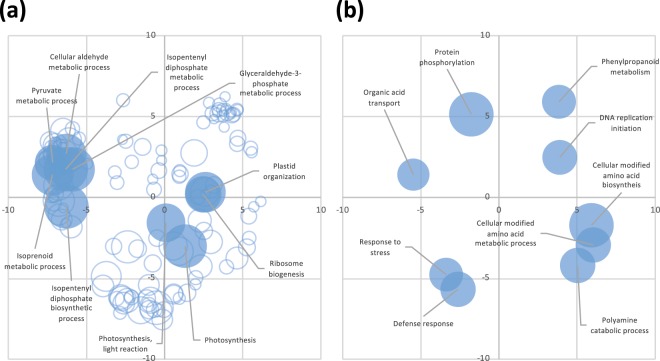
Figure 3.
The GO enrichment analysis for the sets of genes specifically regulated by BTH in Brachypodium distachyon. GO enrichment analysis for the BTH-specific upregulated and downregulated genes were performed using AgriGO47. The significantly over-represented GO terms categorized to biological process in each gene set were summarized and visualized in two-dimensional semantic similarity-based scatter plots using REVIGO27. Panel a shows the summarized GO terms for the “BTH-specific upregulated genes.” Panel b shows the summarized GO terms for the “BTH-specific downregulated genes.” The circle size represents the −log10 transformed FDR value. Circles depicted by filled color with references show the top 10 significantly over-represented GO terms for each gene set.

