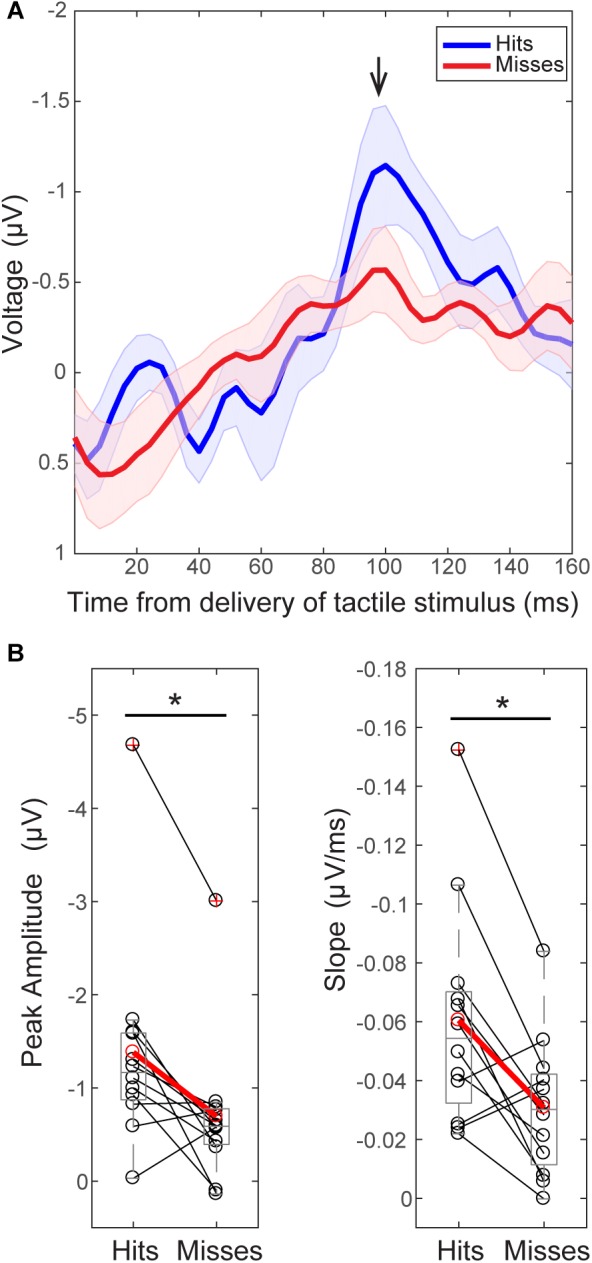
FIGURE 3.

The tactile stimulus-evoked response differs on perceived and non-perceived trials. (A) Grand average EEG (C3 electrode) evoked responses (±SEM) following delivery of the tactile stimulus (t = 0) for all trials during the pre-tACS time block. Black arrow indicates the prominent peak ∼100 ms post-stimulus (minimum value between 92–108 ms, 98.5 ± 0.15 ms). (B) Peak values ∼100 ms were significantly higher on perceived (“hit”, above in blue) than non-perceived (“miss”, above in red) trials across subjects [left, Wilcoxon signed ranks test (WSR), ∗p < 0.05]. The mean slope from ∼70 ms (peak value between 60 and 90 ms, 74 ± 1.6 ms) to ∼100 ms was also significantly larger on perceived (blue, “hit”) than non-perceived (red, “miss”) trials (right, WSR, ∗p < 0.05). Only data from pre-tACS block is included in this analysis.
