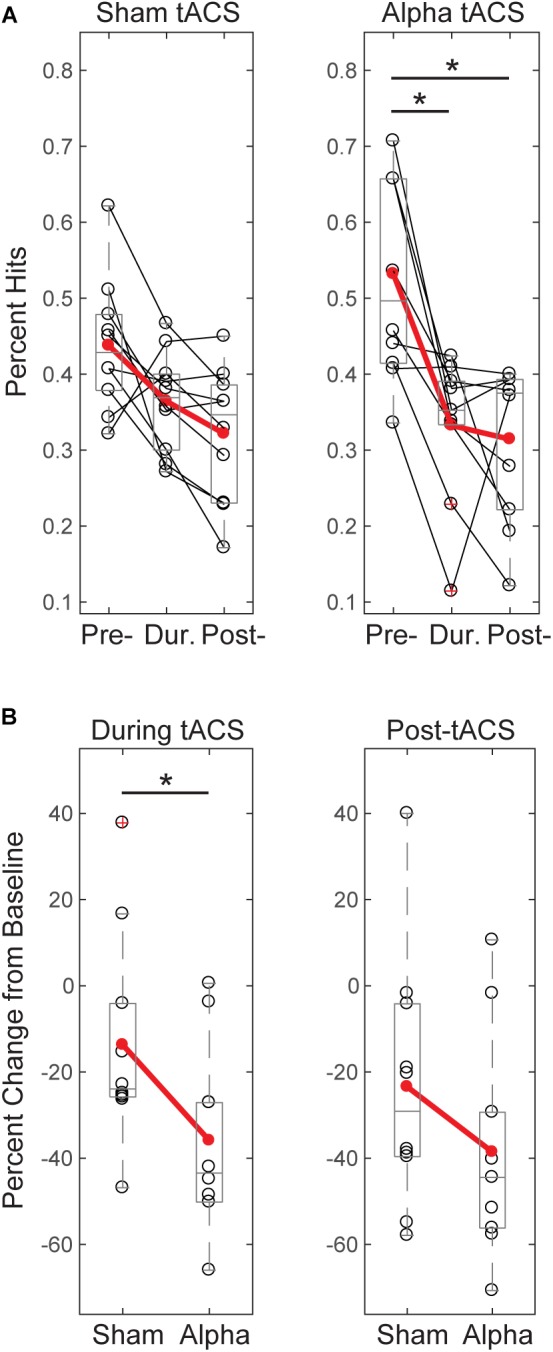
FIGURE 4.

Tactile detection performance decreases over time and differs between groups during tACS. (A) Individual participants’ mean performance (percent hits; black circles) on the tactile detection task before, during and after sham or alpha stimulation. Red circles denote group averages. Performance decreased over time for both sham and alpha tACS groups, with significant differences in performance between pre- and during, and pre- and post-alpha tACS time blocks (Friedman test, p < 0.05; post-hoc Wilcoxon signed ranks tests with Bonferroni correction, ∗p < 0.01). (B) Individual participants’ (black circles) and group averaged (red circles) percent change in performance from baseline shows that participants who received alpha tACS did significantly worse on the task compared to sham during the tACS time block (n = 10/group, Mann–Whitney U test, ∗p < 0.05), but not afterward.
