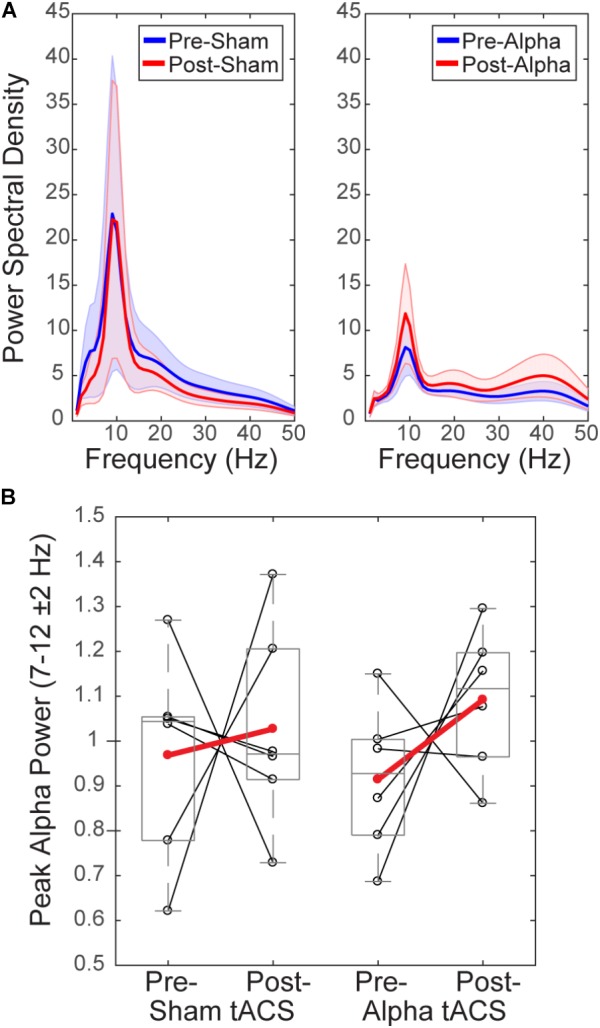
FIGURE 6.

Mean pre-stimulus alpha power is not different before and after tACS. (A) Power spectral density (PSD) plots show mean time–frequency representation (TFR) values (±SEM) over the 1 s time period prior to delivery of the tactile stimulus (–1–0 s), averaged across participants, for frequencies within the alpha range (individual peak frequencies between 7–14 ± 2 Hz). (B) Normalized pre-stimulus alpha power averaged across the pre-stimulus time period is shown for individual subjects (black circles), and averaged within groups (red circles), before and after sham and alpha tACS. Mean pre-stimulus alpha power did not differ significantly within groups (pre- vs. post-) for alpha or sham tACS groups (n = 6/group, Wilcoxon signed ranks test, p > 0.05). There were also no significant differences in mean pre-stimulus alpha power between groups (sham vs. alpha) before or after tACS (Mann–Whitney U test, p > 0.05).
