FIGURE 8.
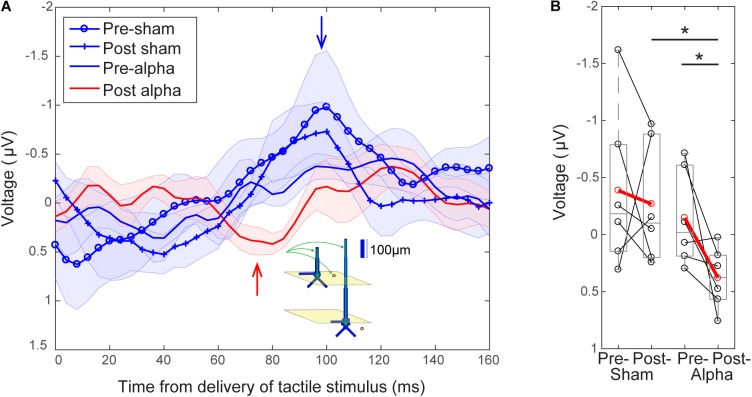
Emergence of a ∼70 ms evoked response peak following tACS. (A) Grand average EEG evoked responses averaged over tACS conditions (±SEM). Waveforms following delivery of the tactile stimulus (at t = 0) all have a relatively uniform shape in the absence of alpha tACS. Pre-sham (blue circles), post-sham (blue crosses) and pre-alpha (blue line) tACS evoked response waveforms possess a characteristic peak ∼100 ms post-stimulus (blue arrow). The post-alpha tACS waveform (red line) has a lower amplitude peak at ∼100 ms, and is marked by the emergence of a downward peak ∼70–80 ms post-stimulus (red arrow). Inset illustrates a potential circuit interpretation of the ∼70–80 ms peak, based on prior computational neural modeling (see “Discussion”). (B) The mean magnitude of the signal near the ∼70–80 ms peak (averaged between 68–84 s) was significantly larger in the post-alpha tACS condition than in both the pre-alpha (Wilcoxon signed ranks test, ∗p < 0.05) and post-sham (Mann–Whitney U test, ∗p < 0.05) tACS conditions.

