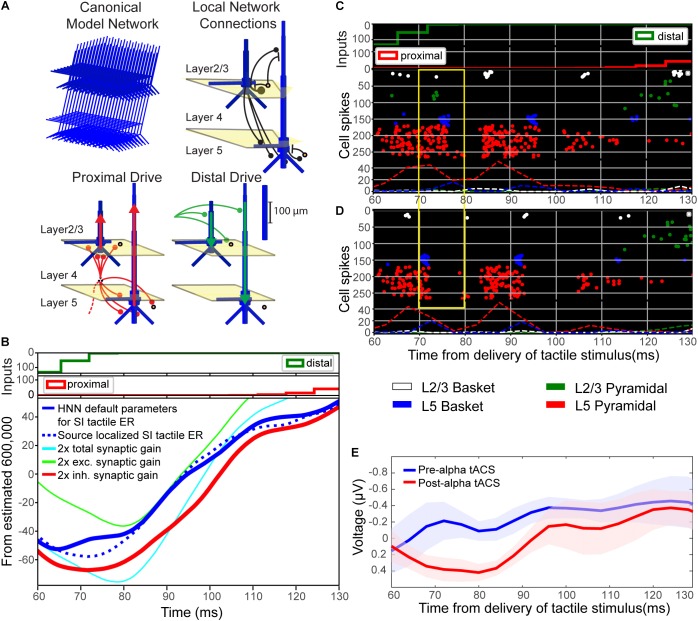
FIGURE 9.
Computational neural modeling suggests enhanced synaptic gain can account for the post-tACS evoked response. (A) Schematic illustration of the primary somatosensory cortex (SI) model network underlying the Human Neocortical Neurosolver (HNN) software. The network is represented by a canonical model of a layered neocortical column (top left), with synaptically coupled inhibitory (yellow circles, basket cells) and excitatory neurons (blue, multi-compartment pyramidal neurons) across layers (top right). It also includes two distinct pathways of exogenous excitatory synaptic network inputs that effectively drive proximal (red) and distal (green) dendrites of the cortical pyramidal neurons (bottom panels). HNN simulates the primary electrical currents underlying EEG/MEG signals (red and green arrows) from net post-synaptic intracellular currents within the large and spatially aligned cortical pyramidal neuron dendrites (see “Materials and Methods” for further details). (B) Simulation of the tactile evoked response from 60 to 130 ms (see Supplementary Figure S1 for additional description of the tactile evoked response simulation). A default model simulation of the SI threshold-level tactile evoked response (solid blue line), provided in HNN, was tuned to MEG data from a prior study (dotted blue line; Jones et al., 2007). Increasing local synaptic gain (i.e., maximal conductance of excitatory and inhibitory synapses) by a factor of 2 in the model simulation (cyan line) reproduced the enhanced ∼70–80 ms peak observed post-tACS. Increasing synaptic gain separately for excitatory or inhibitory populations, respectively, demonstrated that the simulated ∼70–80 ms peak was driven mainly by enhanced inhibitory synaptic gain (red line; compare to E), as opposed to enhanced excitatory synaptic gain (green line). (C,D) Spiking activity of each cell in the network (C) before and (D) after modifying synaptic gain demonstrates that increasing total synaptic gain resulted in decreased firing of layer 5 pyramidal neurons (red circles, yellow box) around the same time as the enhanced ∼70–80 ms peak. (E) EEG tactile evoked responses from 60 to 130 ms during pre- and post-tACS time blocks. The pre-alpha tACS EEG evoked response (blue line) closely resembles the simulation of a threshold-level tactile evoked response (compare to solid blue line, B), while the post-alpha tACS EEG evoked response most closely resembles the model simulation with enhanced inhibitory synaptic gain (compare to red line, B).

