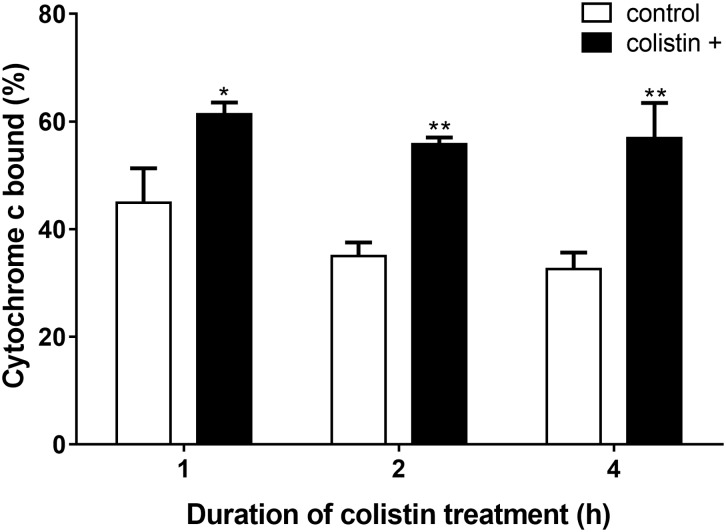
FIGURE 5.
Detection of cationic cytochrome c binding to whole S. aureus BA01611 cells in the presence or absence of colistin. The figure shows the percentage of bound cytochrome c after incubating S. aureus BA01611 with colistin for 1, 2, or 4 h. Data are presented as means ± standard deviations. The statistical analysis was performed using a one-way analysis of variance (ANOVA) with the least significant difference (LSD) test. ∗P < 0.05, ∗∗P < 0.01 in comparison with the control group.

