
FIGURE 6.
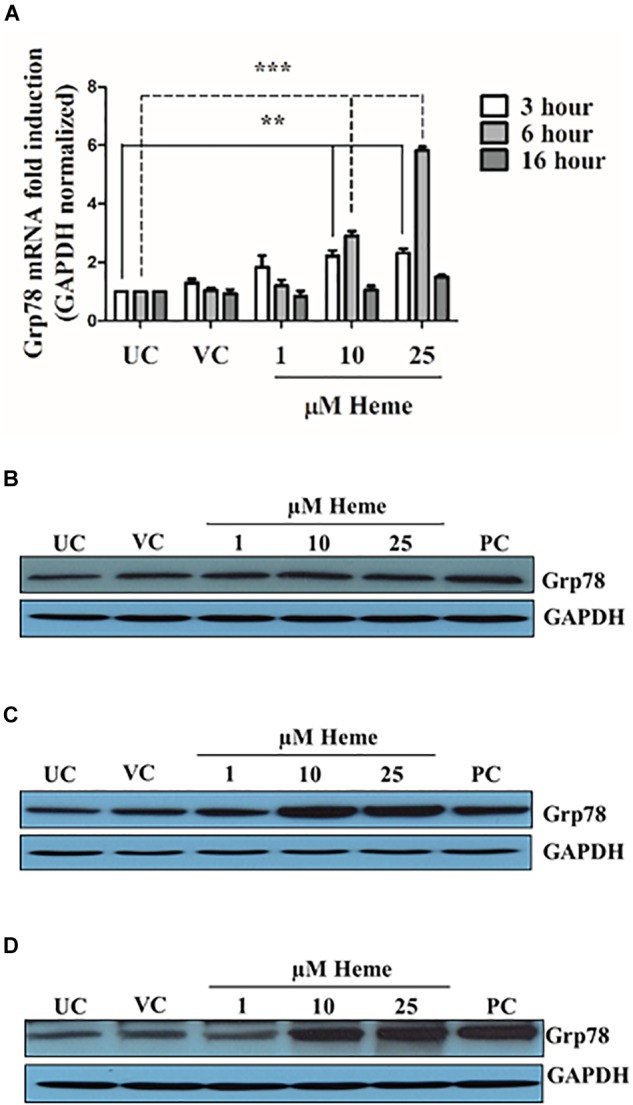
Heme induces Grp78 expression in a time- and dose-dependent manner. Cells were treated either with heme or vehicle as mentioned above. Grp78 expression was measured using qRT-PCR and immunoblot (A–D). (A) Relative expressions of Grp78 was determined by qRT-PCR, normalized to GAPDH and compared to the untreated controls at each time points. Results are presented as mean ± SD of five independent experiments performed in duplicates. ∗∗p < 0.01, ∗∗∗p < 0.001. (B–D) Representative Western blots of whole cell lysates from five independent experiments are shown representing Grp78 protein levels (B) 3, (C) 6, and (D) 16 h after the heme treatment.