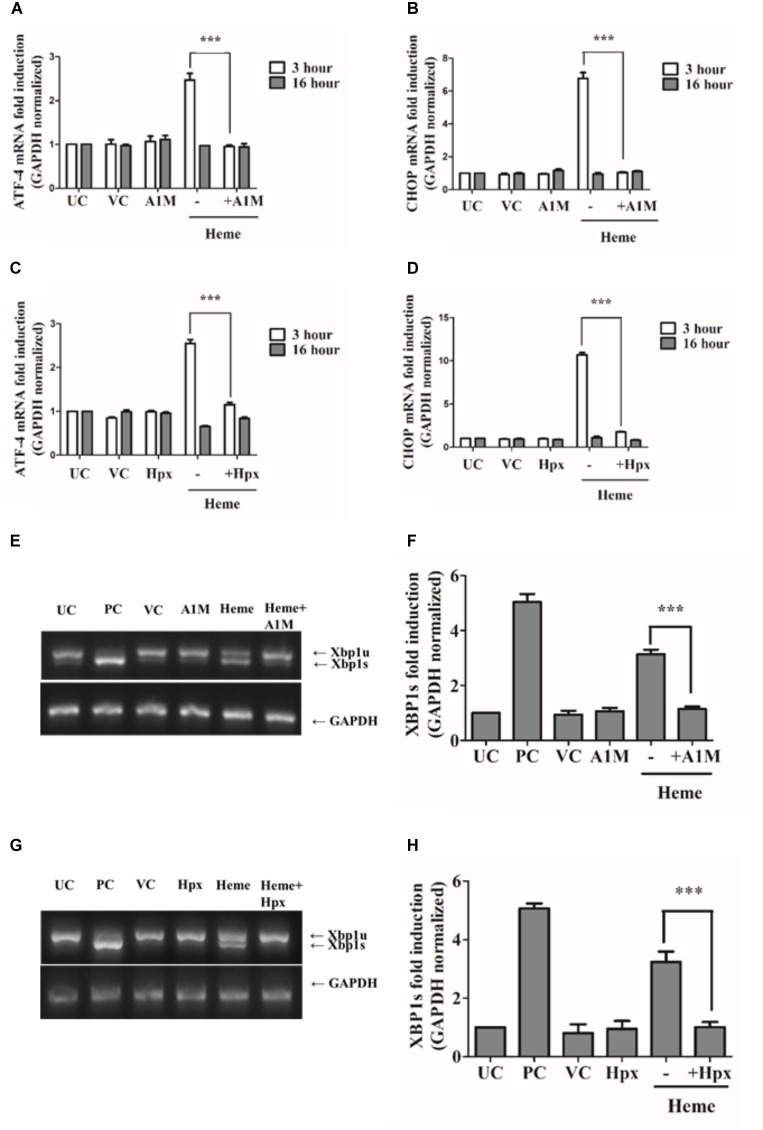
FIGURE 8.
A1M and Hpx attenuates ATF4 and CHOP gene induction as well as IRE1/XBP1s activation. Cells were treated with heme (25 μM) or heme + rA1M (25 μM heme + 12.5 μM rA1M) or equimolar amonts of heme + Hpx (25 μM heme + 25 μM Hpx) for 60 min in serum-free DMEM. Medium was then replaced with DMEM + 10% FCS and antibiotics. ATF4 and CHOP gene induction in response to heme were measured using qRT-PCR 3 and 16 h after the heme challenge (A–D), while XBP1 splicing was assessed 3 h after the heme treatment by RT-PCR followed agarose gel electrophoresis and quantified by densitometry (E–H). (A–B) Relative expressions of ATF4 and CHOP in response to heme and heme + rA1M complex were determined by qRT-PCR, normalized to GAPDH. ATF4 and CHOP levels of rA1M + heme treated cells were compared to those detected in heme challenged cells. Results are presented as mean ± SD of five independent experiments performed in duplicates. ∗∗∗p < 0.0001 using unpaired t-test (C–D) Relative expressions of ATF4 and CHOP in response to heme and heme + Hpx complex were determined by qRT-PCR, normalized to GAPDH. ATF4 and CHOP levels of Hpx + heme treted cells were compared to those detected in heme challenged cells. Results are presented as mean ± SD of five independent experiments performed in duplicates. ∗∗∗p < 0.0001 using unpaired t-test. (E–F) Cells were treated with heme or heme + rA1M as described above. Expression of spliced XBP1 (XBP1s) was measured 3 h after the treatment with RT-PCR followed by densitometric analysis of XBP1s after running PCR products on 2% agarose gel. XBP1s levels were normalized to GAPDH. Results are presented as mean ± SD of five independent experiments performed in duplicates. ∗∗∗p < 0.0001 using unpaired t-test. (G,H) Cells were treated with heme or heme + Hpx as described above. Expression of spliced XBP1 (XBP1s) was measured 3 h after the treatment with RT-PCR followed by densitometric analysis of XBP1s after running PCR products on 2% agarose gel. XBP1s levels were normalized to GAPDH. Results are presented as mean ± SD of five independent experiments. ∗∗∗p < 0.0001 using unpaired t-test.

