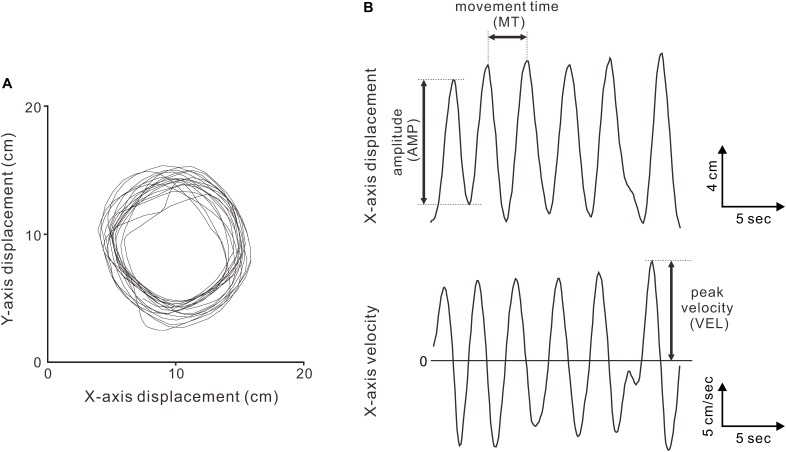
FIGURE 2.
Kinematics of the circular movements. (A) Displacement data (x-y plot) for two minutes in a representative subject (the 90 ms-delay condition). (B) Displacement (top) and velocity (bottom) data in the x-axis dimension. The peak-to-peak amplitude (AMP), movement time per cycle (MT), and peak velocity (VEL) were measured.

