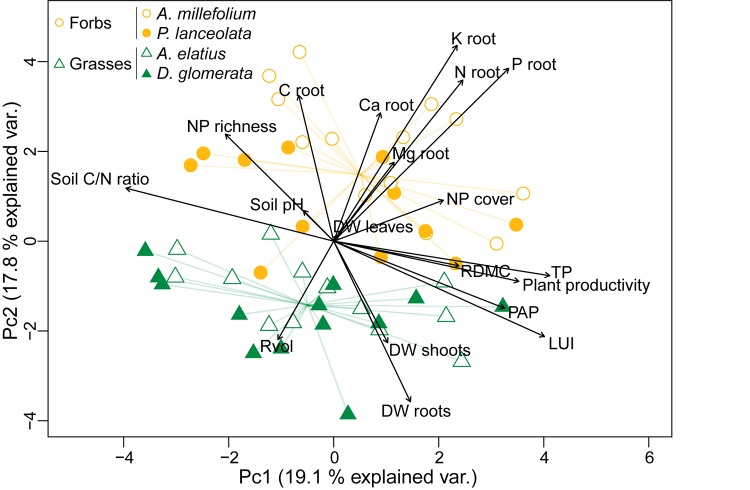
FIGURE 1.
Principal component analysis (PCA) plot showing the multivariate variation among 104 samples in terms of plant traits and environmental variables. Vectors indicate the direction and strength of each plant trait and environmental variable to the overall distribution. Colored symbols correspond to the two plant functional groups (grasses versus forbs) defined in this study.

