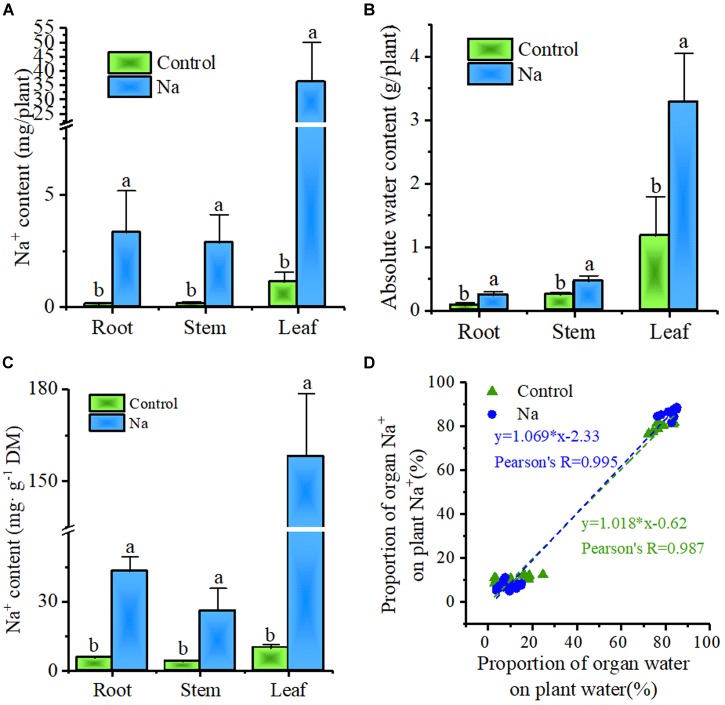
FIGURE 6.
Plant water distribution is positively correlated with plant Na+ distribution in root, stem, and leaf organs. The samples for this experiment were third- and fourth-node leaves from 2-week-old Z. xanthoxylum seedlings treated with 50 mM NaCl or without (control) for 7 days. (A) Na+ content in root, stem, and leaf organs. (B) Absolute water content in root, stem, and leaf organs. (C) Na+ concentration in root, stem, and leaf organs. (D) Correlation analysis between the proportional distribution of Na+ and water in different organs across the whole plant. Bars represent the mean ± SD (n = 8), with different letters indicating significantly different at the level of 0.05.

