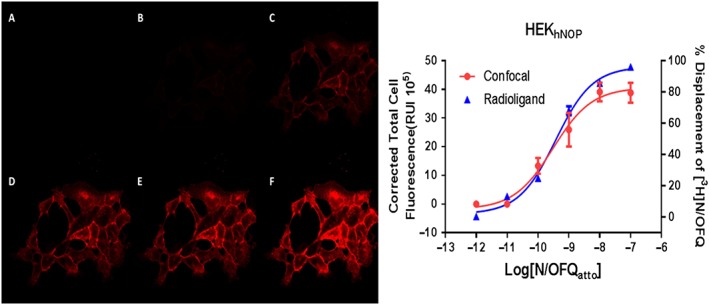
Figure 2.

Concentration‐dependent binding of N/OFQATTO594 to HEKhNOP cells using confocal microscopy and stimulation with 594 nm laser and [3H]‐N/OFQ. On the left representative images of the binding of various concentrations (A: 1 pM; B: 10 pM; C: 100 pM; D: 1 nM; E: 10 nM; F: 100 nM) of N/OFQATTO594 using confocal microscopy. On the right are the binding curves analysed as in methods overlayed with data from a [3H]‐N/OFQ displacement analysis; data are mean ± SEM for five experiments. Confocal experiments were performed at 4°C while radioligand binding assays were performed at room temperature.
