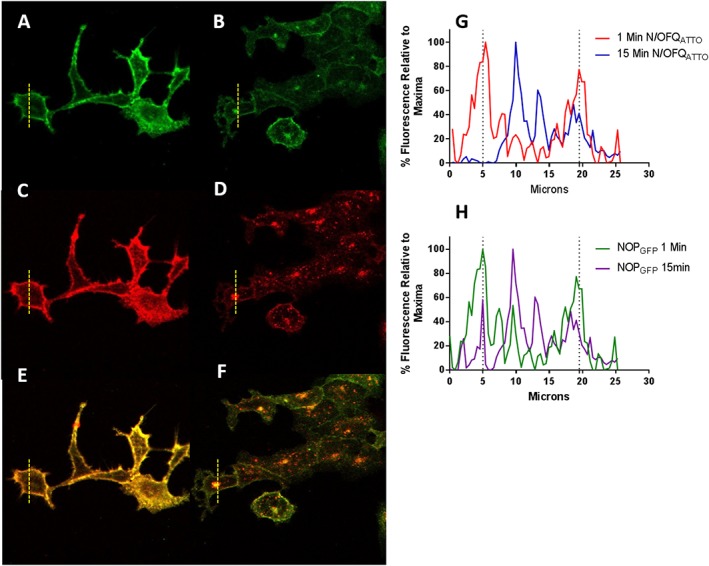
Figure 5.

Use of N/OFQATTO594 and NOPGFP to examine cell surface receptor expression. All images depict HEKhNOP‐GFP cells. Panels A, C and E are at 4°C and measured 1 min after ligand addition while panels B, D and F are at 37°C, 15 min after ligand addition. Green channel for NOPGFP is in A and B; red channel for N/OFQATTO594 is in C and D, and the overlap is in E and F. Panel G shows a representative graph of the initial binding of N/OFQATTO594 (red; 1 min after adding N/OFQATTO594) and subsequent change in localization (blue; 15 min after adding N/OFQATTO594). Panel H shows a representative graph of initial location of NOPGFP (green; 1 min after adding N/OFQATTO594) and subsequent change in localization (purple; 15 min after adding N/OFQATTO594) In (G and H), the dotted lines are used to indicate the position of the membrane with the cell interior between the two.
