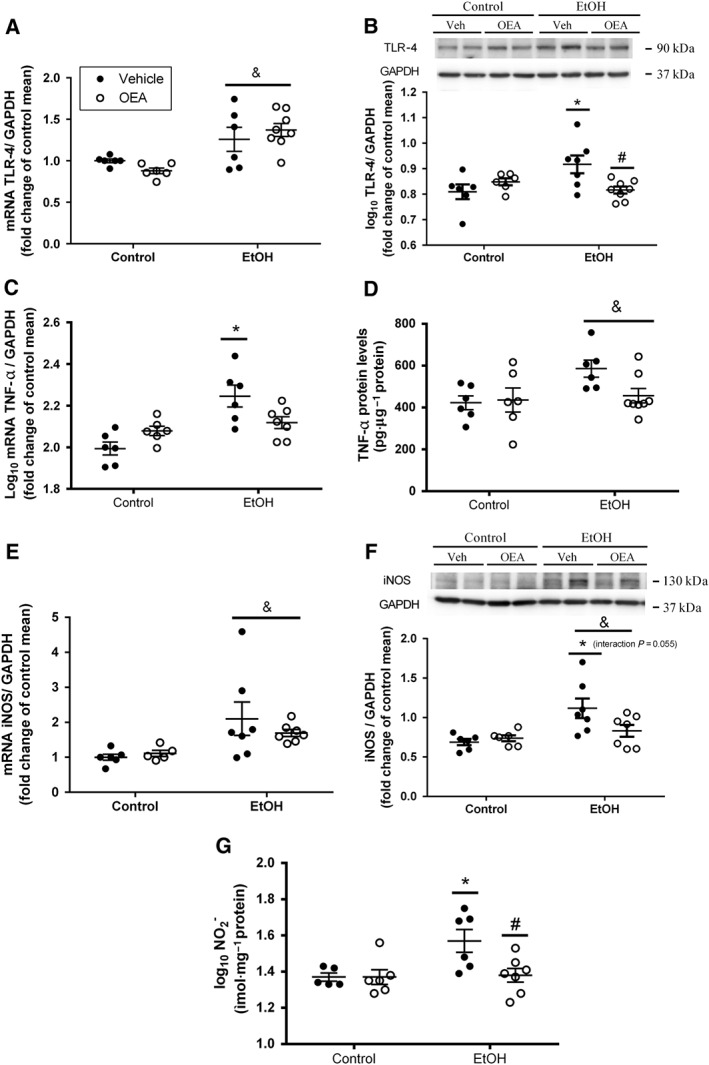
Figure 2.

Activation of inflammatory components in distal colon after binge ethanol administration and effects of OEA i.p. pretreatment. (A) Relative mRNA levels of innate immunity receptor TLR4; (B) protein levels of TLR4; (C) relative mRNA levels of TNF‐α; (D) protein levels of TNF‐α; (E) relative mRNA levels of iNOS; (F) protein levels of iNOS; (G) quantification of nitrite levels in homogenized colonic samples. Results are presented as biological samples [Control + Vehicile (Veh) n = 6; Control + OEA n = 6; EtOH + Veh n = 7; EtOh + OEA n = 8] with the mean ± SEM. Overall ethanol effect: & P < 0.05 (two‐way ANOVA). Different from control group in the same condition: *P < 0.05; differences between ethanol and ethanol + OEA groups: # P < 0.05 (two‐way ANOVA, Bonferroni post hoc test after interaction).
