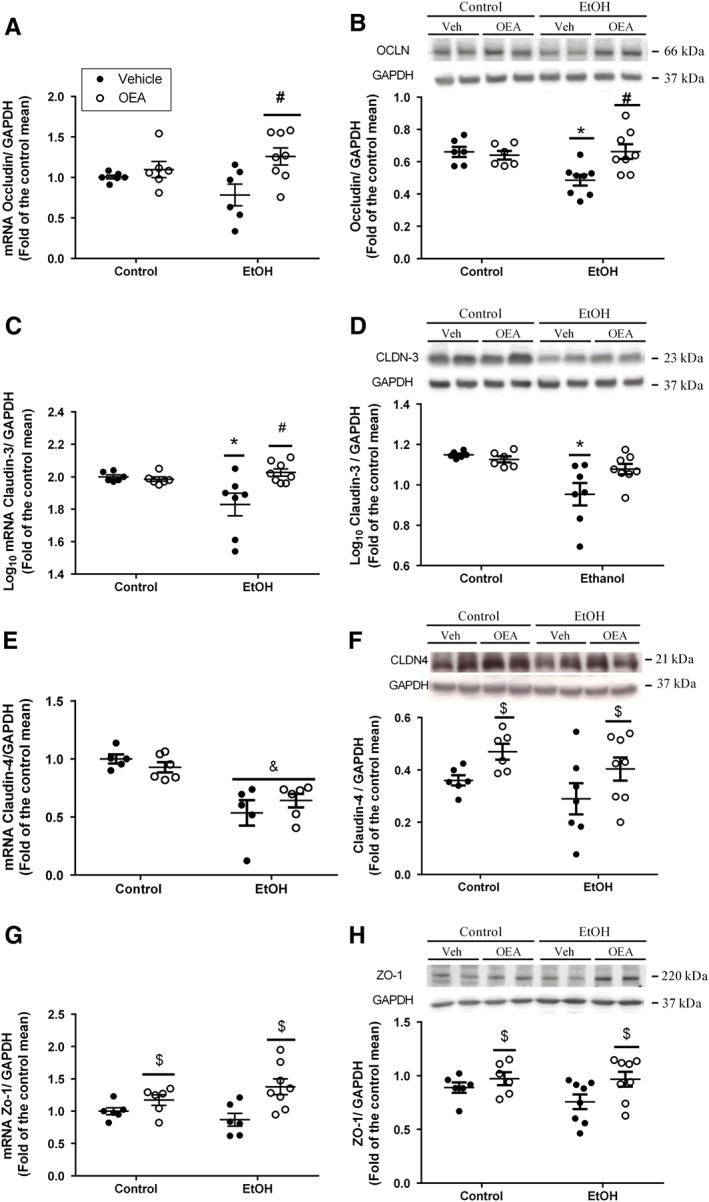
Figure 4.

Alterations in colonic tight junction elements forming the intestinal barrier by ethanol binge administration and OEA i.p. pretreatment. Relative mRNA levels (left panels) and Western blot analyses (right panels) of (A, B) occludin, (C, D) claudin‐3, (E, F) claudin‐4 and (G,H) ZO‐1. Results are presented as biological samples [Control + Vehicle (Veh) n = 6; Control + OEA n = 6; EtOH + Veh n = 8; EtOh + OEA n = 8] with the mean ± SEM. Overall OEA effect: $ P < 0.05 (two‐way ANOVA). Different from control group in the same condition: *P < 0.05; differences between ethanol and ethanol + OEA groups: # P < 0.05 (two‐way ANOVA, Bonferroni post hoc test after interaction).
