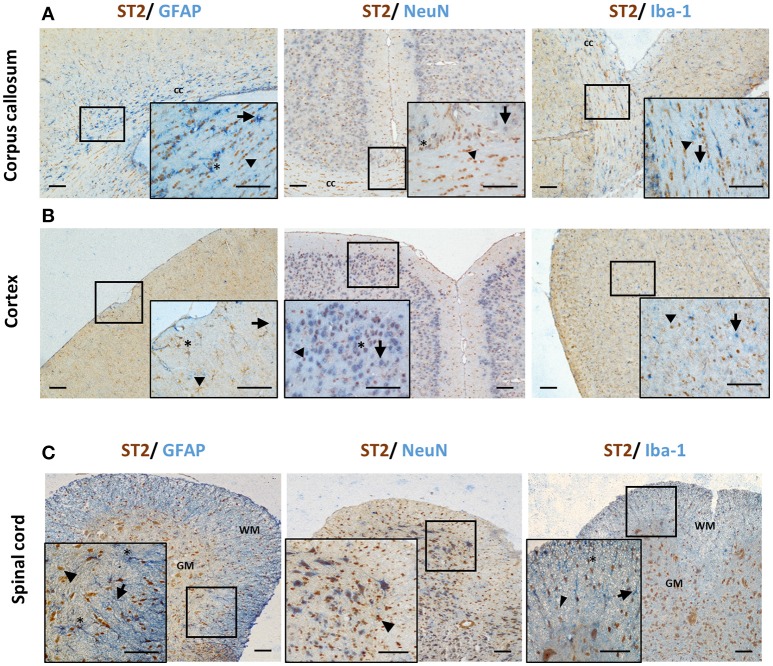
Figure 4.
ST2 expression by CNS resident cells in mouse brain and spinal cord. Tissues from C57BL/6 mice were sectioned and stained for the expression of ST2 (brown) and astrocytes (GFAP), neurons (NeuN) and microglia (Iba-1) (all blue) within the (A) corpus callosum and (B) hippocampus and ST2 co-localization assessed. The majority of ST2 expressing cells co-localized with GFAP+ astrocytes while low level co-localization with neurons and microglia was observed in both regions. (C) In spinal cord, the majority of ST2 expressing cells were localized to the GM, with lower levels present in the WM. ST2 was expressed by NeuN+ neurons in both GM and WM regions with lower level co-localization with astroyctes and microglia. Arrowheads indicate ST2+ cells, arrows indicate NeuN, GFAP or Iba-1+ cells and asterisks indicate double positive cells. cc, corpus callosum; GM, gray matter; WM, white matter. Scale bars represent 100 μm.

