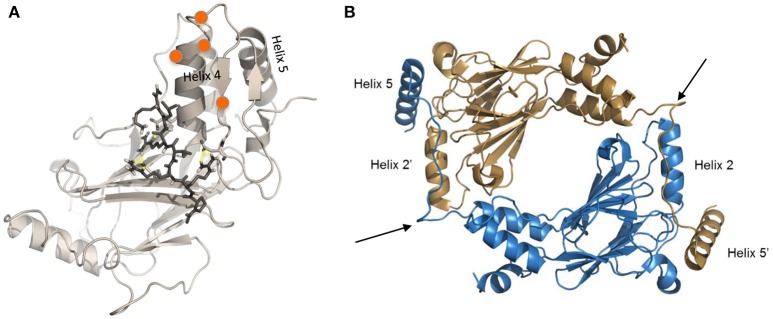
Figure 3.
Modified crystal structures of IRF5. (A) Homology model of the inactive IRF5 C-terminal domain (variant 5) generated using the monomeric autoinhibited IRF3 C-terminal domain (PDB: 1QWT) as a template (113). Representative image from docking of an inhibitor (112) to the C-terminal SRR of the inactive IRF5 monomer, which results in maintenance of a closed, non-phosphorylated conformation. Orange balls represent phosphorylation sites at the C-terminal SRR. (B) Representative image generated from IRF5 crystal structure coordinates (13) showing formation of an IRF5 homodimer. Arrows show critical regions that are being therapeutically targeted to inhibit homodimerization between Helix 2 and Helix 5 (111).

