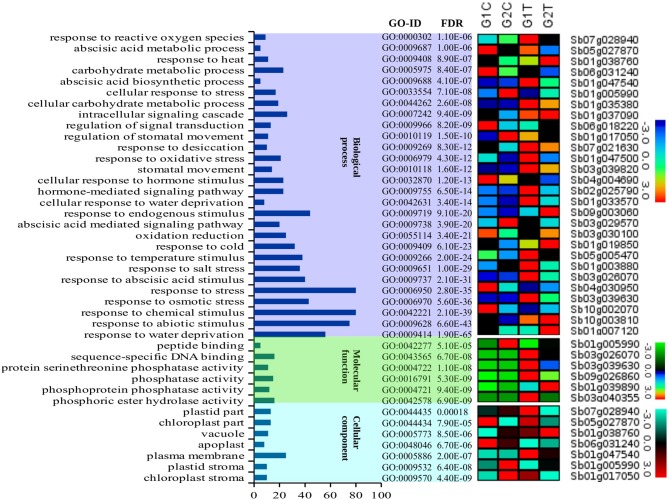
Figure 1.
A description of the GO enrichment analysis and corresponding gene expression profile. The figure summarizes a description of the three main GO categories namely biological process, molecular function and cellular component and 41 sub-categories for the GO-terms assigned to the sorghum genes that were involved in drought associated pathways and the corresponding genes that were up and down regulated under drought condition. The different color background shows the different classes of GO categories (x-axis). The number of genes classified in each GO category are shown in the y-axis. To indicate the enrichment level of the GO-terms in the GO categories, we show the associated GO-IDs and the corresponding p-values (FDRs). The expression pattern of 41 representative genes to which the corresponding categories of GO-terms were assigned was based on the leaf tissue of 2 sorghum varieties (GSE30249).

