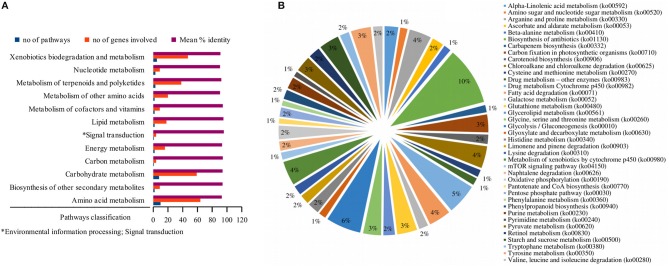
Figure 2.
Functional classification of the pathways. While the bar graph in this figure demonstrates the functional classes of the pathways based on specific type of metabolic class to which a particular pathway is grouped (A), the pie chart shows the functional categories of the pathways based on the type and function of drought-related differentially expressed genes that were involved in the pathway (B). The x-axis in (A) shows the functional classes of the pathways, while the y-axis shows the number of pathways, the genes involved and mean percent identity of pathways involved in the metabolic classes of the pathways. The distribution of the differentially expressed genes under stress condition among the pathways signifies the functional categories of the pathways in (B). Information on the KEGG pathway annotations and enrichment analysis was based on the Blast2GO using 1e-10 e-value threshold.

