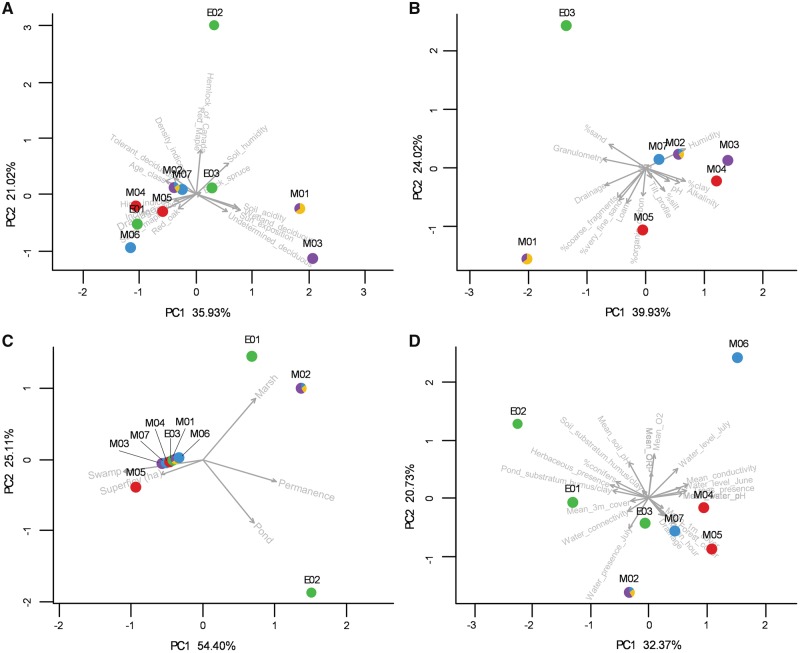
Figure 2:
distribution of the sampling sites according to environmental conditions. Results of the principal component analyses according to (A) variables from the forest maps, (B) soils characterization (sites M06, E01, and E02 are absent), (C) the interactive maps of detailed mapping of wetlands, and (D) characterization of the sites’ conditions performed in this study (sites M01 and M03 are absent). Colors represent the presence of lineages at a given site. Arrows represent the explanatory vectors

