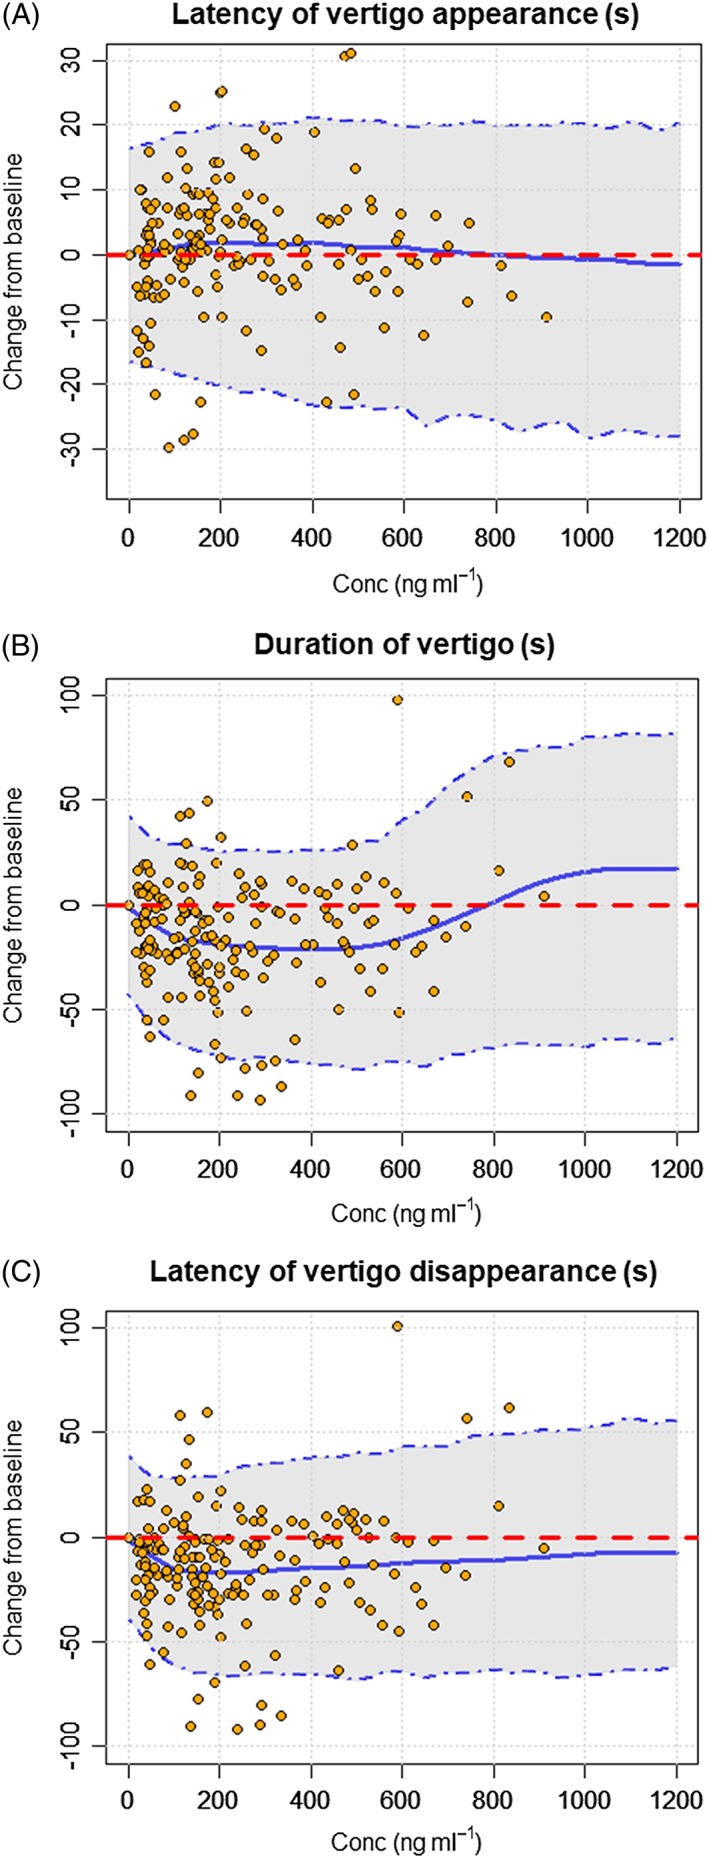
Figure 2.

Visual predictive checks (VPCs) of the PK/PD model for latency of vertigo appearance (A), duration of vertigo (B) and latency of vertigo disappearance (C). The blue lines represent the 5th, 50th and 95th percentiles of the simulated data and the orange circles represent the observed data
