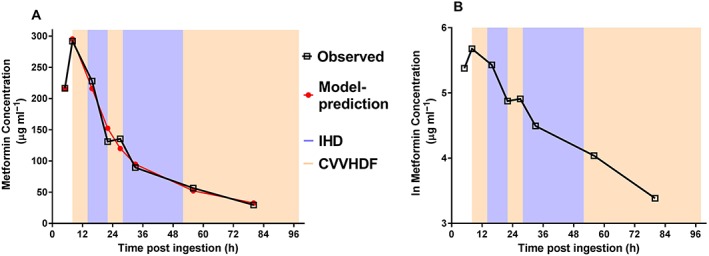
Figure 2.

Plots of the observed and predicted metformin concentrations vs. time in relation to intermittent haemodialysis (IHD: blue shaded area) and continuous venovenous haemodiafiltration (CVVHDF: pink shaded area) as (A) untransformed data and (B) natural log of the data
