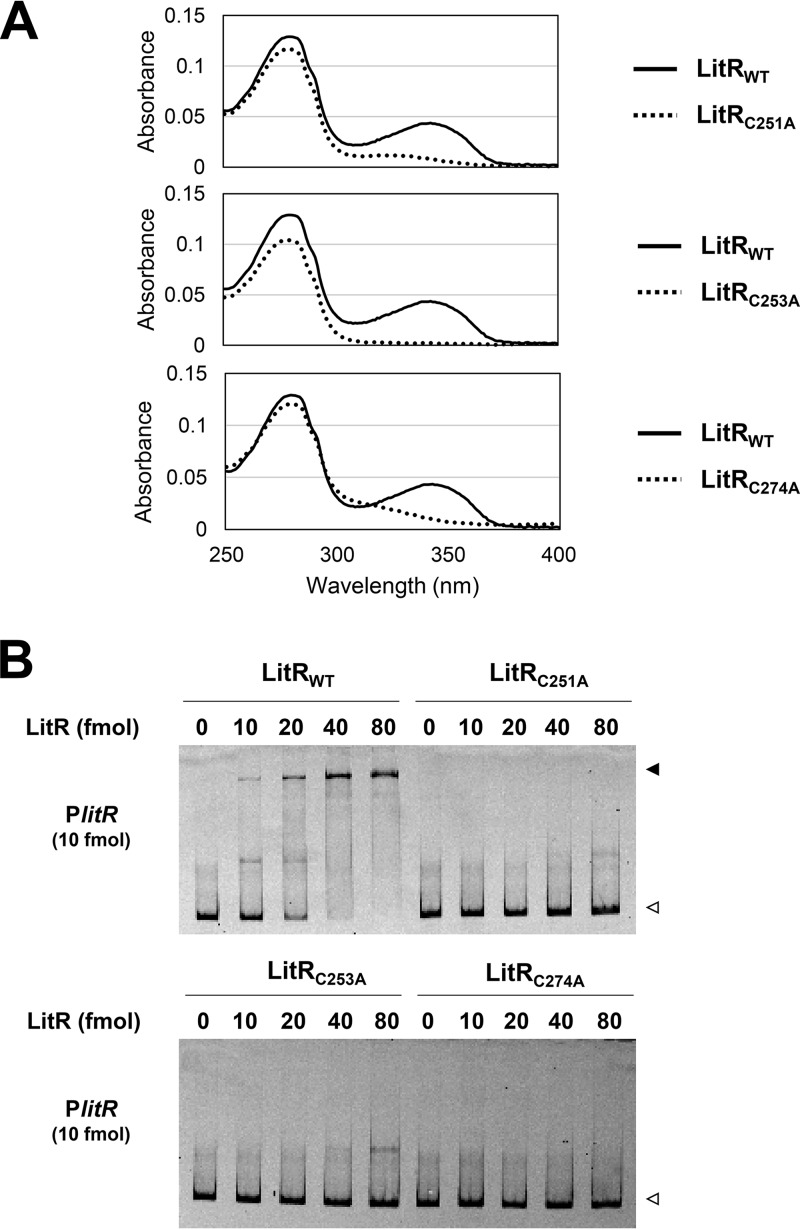
FIG 7.
Features of LitR mutant proteins (A) Absorbance spectra. The absorbance spectra of the dark-incubated LitRC251A (top graph), LitRC253A (middle graph), and LitRC274A (bottom graph) (5.6 μM) are shown by dashed lines. The absorbance spectrum of the wild-type LitR (LitRWT) is shown by solid lines. (B) Gel shift assay. LitR mutant proteins (0 to 80 fmol) were incubated with the Cy5-labeled probes (10 fmol) for PlitR (306 bp) and loaded onto a nondenaturing polyacrylamide gel. Open and closed arrowheads indicate the probe alone and probe-protein complex, respectively.

