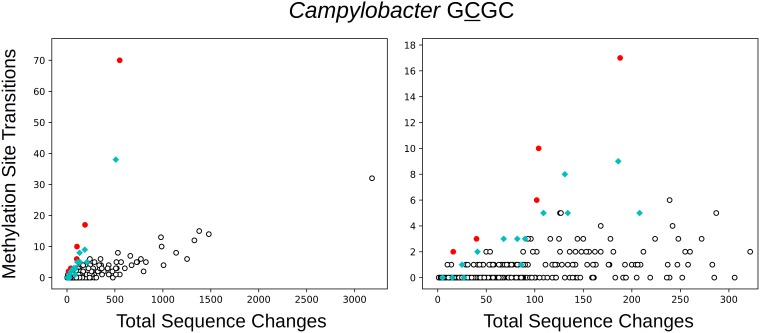
FIG 6.
The number of transitions at GCGC positions in Campylobacter clusters as a function of the total number of sequence changes. Red indicates the presence of an MTase predicted to methylate GCGC. Cyan indicates the presence of another MTase that is inferred, on the basis of the relationship shown in the figure, to methylate at least some GCGC sites.

