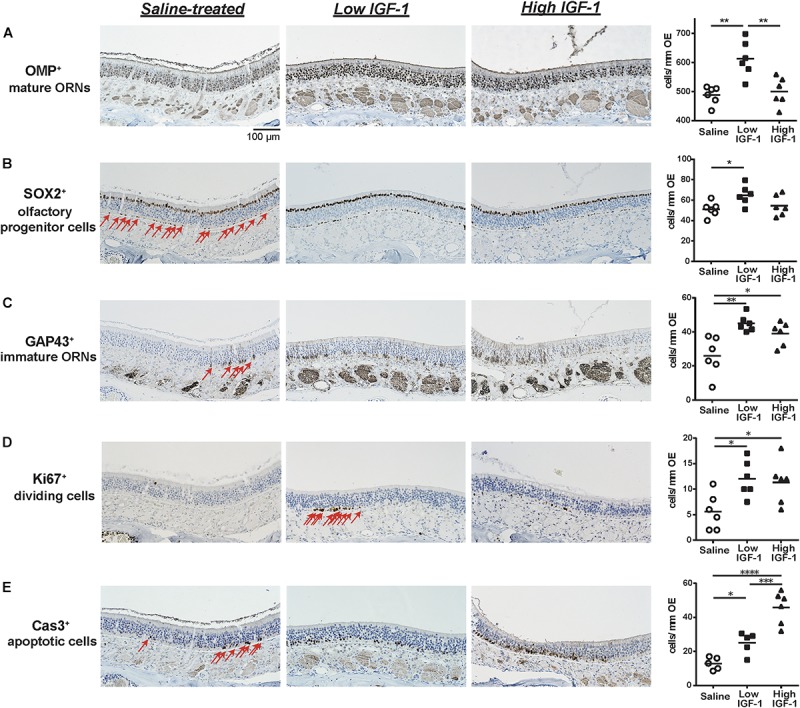
FIGURE 2.

Representative images of immunohistological staining (brown) of OMP-positive (OMP+) cells (A), SOX2+ ORN progenitor cells (B), GAP43+ immature ORNs (C), Ki67+ proliferating cells (D), and cleaved Cas3+ apoptotic cells (E). Each cell except for many OMP+ cells is indicated by arrows. Tissue sections were counterstained with the nuclear dye hematoxylin (blue). Numbers of SOX2+ ORN progenitors and Ki67+ actively proliferating cells per mm of the basal layer and OMP+ mature ORNs, GAP43+ immature ORNs, and Cas3+ apoptotic cells per mm of the OE in saline or rhIGF-1-treated mice. Open circles, rectangles, and triangles represent the values for each mouse in the saline, low-IGF-1, and high-IGF-1 treated groups (each n = 6), respectively. The horizontal lines represent the mean value for each group. ∗P < 0.05; ∗∗P < 0.01; ∗∗∗P < 0.001; and ∗∗∗∗P < 0.0001 (one-way ANOVA).
