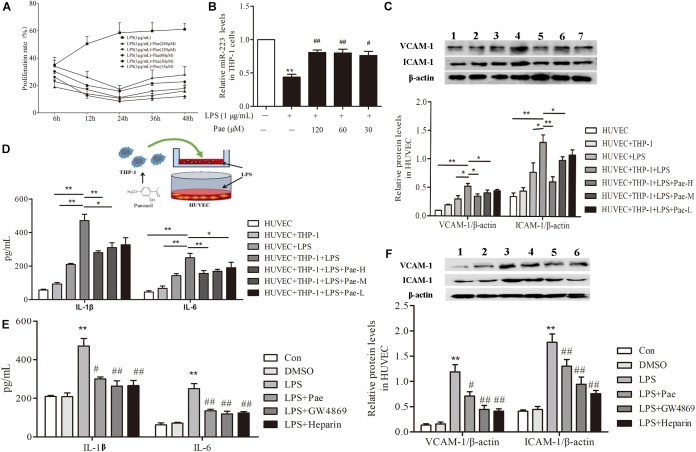
FIGURE 2.
Paeonol decreased inflammatory response of HUVECs in the co-culture system with THP-1 Cells. (A) THP-1 cells were treated with the indicated concentration of paeonol (15–240 μM) for different period of time (6, 12, 24, 36, 48 h) in the presence of LPS (1 μg/mL). The optimal dosage of paeonol was detected by CCK8 assay with THP-1 cells proliferation as an index. (B) The expression of miR-223 in LPS-stimulated THP-1 cells. The data were expressed as mean ± SEM, n = 6. ∗∗P < 0.01 vs. Control group, #P < 0.05, ##P < 0.01 vs. LPS group. (C) (1) HUVEC group. (2) HUVEC + THP-1 group. (3) HUVEC + LPS group. (4) HUVEC + THP-1 + LPS group. (5) HUVEC + THP-1 + LPS + Pae-H group. (6) HUVEC + THP-1 + LPS + Pae-M group. (7) HUVEC + THP-1 + LPS + Pae-L group. THP-1 cells were pretreated by paeonol (30, 60, 120 μM) for 24 h and LPS (1 μg/mL) for another 24 h. Then HUVECs were co-cultured with the THP-1 cells. The VCAM-1 and ICAM-1 levels in co-cultured HUVECs. (D) The IL-1β and IL-6 levels in co-cultured HUVECs. Data are the mean ± SEM, n = 3. ∗∗P < 0.01 vs. HUVEC group, ΔΔP < 0.01 vs. HUVEC + LPS group, #P < 0.05, ##P < 0.01 vs. LPS group. (E) The effects of GW4869 (10 μM) and Heparin (10 μg/mL) on IL-1β and IL-6 levels in co-cultured HUVECs. The concentration of paeonol was 60 μM. (F) (1) Control group. (2) DMSO group. (3) LPS group. (4) LPS + Pae group. (5) LPS + GW4869 group. (6) LPS + Heparin group. The effects of GW4869 (10 μM, 8 h) and Heparin (10 μg/mL, 24 h) on VCAM-1 and ICAM-1 levels in co-cultured HUVECs. ∗∗P < 0.01 vs. HUVEC group, ##P < 0.01, #P < 0.05 vs. LPS group.

