Figure 2.

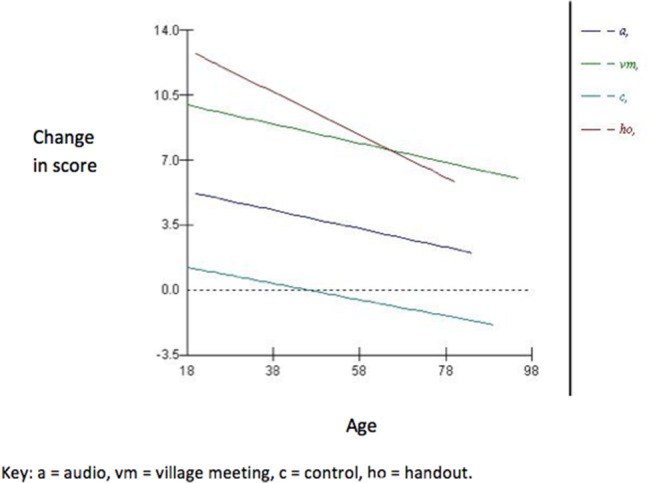
Plot showing the effect of the significant interaction between age and interventions in the multilevel linear regression model (Model 2).

Plot showing the effect of the significant interaction between age and interventions in the multilevel linear regression model (Model 2).