
Figure 2.
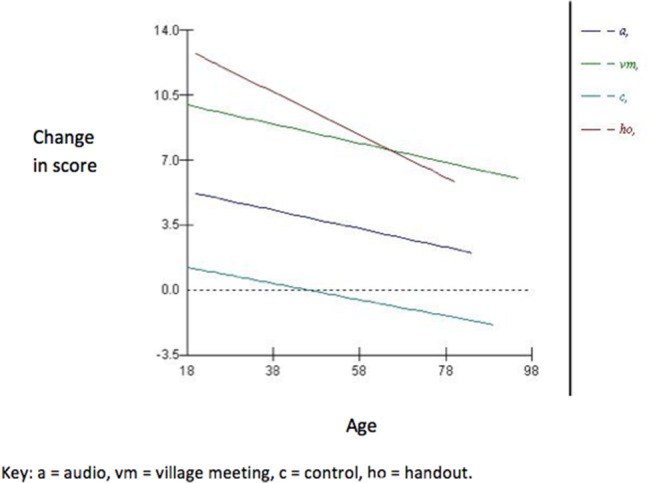
Plot showing the effect of the significant interaction between age and interventions in the multilevel linear regression model (Model 2).
Official websites use .gov
A
.gov website belongs to an official
government organization in the United States.
Secure .gov websites use HTTPS
A lock (
) or https:// means you've safely
connected to the .gov website. Share sensitive
information only on official, secure websites.
Plot showing the effect of the significant interaction between age and interventions in the multilevel linear regression model (Model 2).