
Figure 1.
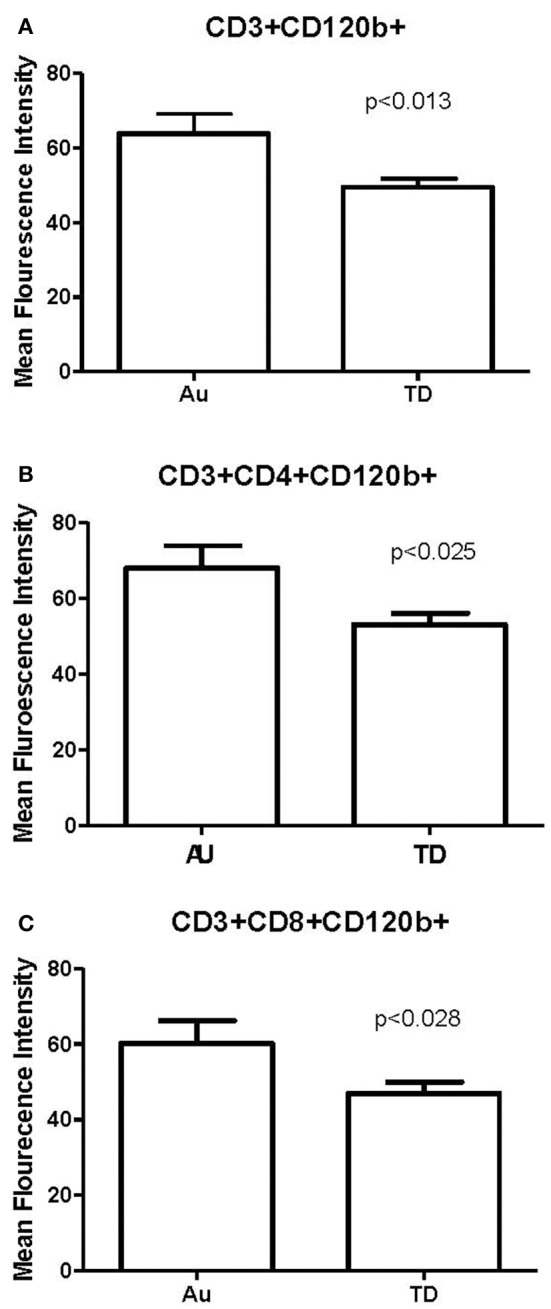
Comparison of CD120b (TNFRII) on T cells and T cell subsets following PHA stimulation in children with autism (Au: n = 36) and frequency and geographically matched typically developing (TD; n = 27). Data are expressed as a Mean Fluorescence intensity (MFI) of CD120b on (A) CD3+ T cells, and (B) CD3+CD4+ and (C) CD3+CD8+ T cell subsets. Data is represented as Mean and standard error of mean, exact p-values included.