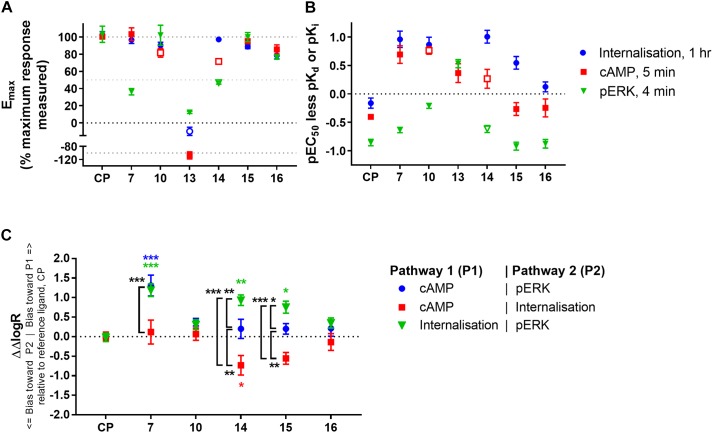
FIGURE 5.
Comparison of ligand efficacy, potency (relative to binding affinity), and signalling pathway bias for CP 55,940 and 2,4,6-trisubstituted 1,3,5-triazines. (A) Internalisation, inhibition of cAMP production and stimulation of pERK Emax for each compound normalised to the overall maximum response measured at a single concentration in each pathway. Hollow symbols represent efficacy measures where conclusive Emax values could not be determined; for 10 and 14 cAMP Emax is approximate due to the presence of non-hCB2-mediated effects, for 14 pERK and 13 internalisation efficacy at 10 μM is plotted because fully-defined concentration-response curves could not be drawn. (CP, CP 55,940) (B) pEC50 for the three signalling pathways indicated less pKd (for CP 55,940, CP) or pKi (for the 2,4,6-trisubstituted 1,3,5-triazines). Hollow symbols represent potency measures where conclusive EC50 values could not be determined; for 10 and 14 cAMP EC50 is approximate due to the presence of non-hCB2-mediated effects, for 14 pERK EC50 is approximate due to its low potency. (C) Between-signalling pathway bias as represented by ΔΔlogR in comparison with CP 55,940 (CP) as a reference ligand. 13 could not be included in the bias quantitation as it is an agonist in only one pathway. The symbol “∗” in colour indicates significant difference from CP 55,940 for the same bias comparison; The symbol “∗” in black and white indicates significant difference for the comparison indicated by the associated bracket; significance levels as defined in the methods. Data in all panels are presented as mean ± SEM from three independent experiments.

