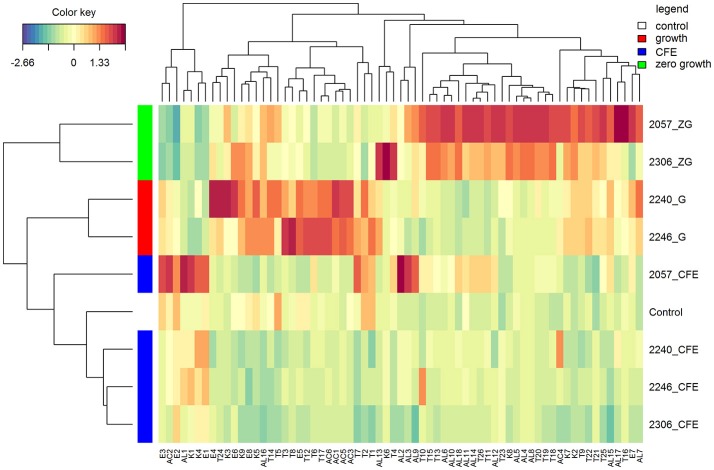
Figure 2.
Hierarchical clustering analysis and heatmap visualization of the volatile profiles of the elderberry added with zero growth (ZG) strains, growing strains (G), or cell-free extracts (CFE), and the unstarted juice (control), based on the Euclidean distance calculated on the amount of each volatile compound. The leftmost column bar is colored according to the growth condition used for the fermentation, as reported in the legend. The color scale represents the scaled abundance of each variable, denoted as d2 (squared Euclidean distance), with red indicating high abundance and blue indicating low abundance. The compounds represented in the heat-map are named as in Table 2.

