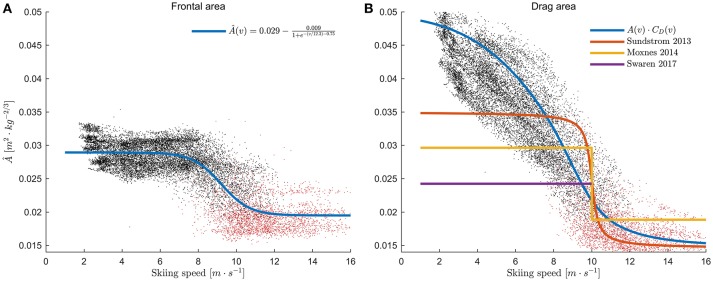
Figure 6.
(A) Frontal areas (Â) estimated from the accelerometer outputs plotted over skiing speed, normalized by body mass (using an allometric scaling coefficient of 2/3). Red dots represent measurements where the skiers were in the tucked position. Blue line: logistic function fitted to the data (Equation 6). Athletes typically assumed the tucked position at skiing speeds >9.1 m·s−1. (B) Drag areas normalized to body mass (·CD) found in the current study plotted over skiing speed for all athletes. The blue line shows the product of the frontal area model from Equation 6 (plotted in panel A) and the drag coefficient (Equation 8, Figure 2). Models used by Sundström et al. (2013), Moxnes et al. (2014), and Swarén and Eriksson (2017) are included for comparison.

