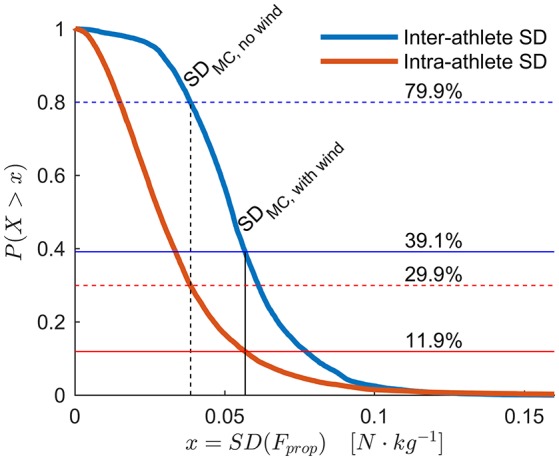
Figure 8.

In order to discriminate the Fprop or Pprop generated by high-level athletes, the methods accuracy must be better than typical athlete-to-athlete or within-athlete differences. To that end, this figure displays the empirical complementary cumulative distribution function (ECCDF) of typical athlete-to-athlete differences in Fprop measured at the same position along the course (blue line). More specifically, it shows the between-athlete standard deviation of Fprop evaluated at every integer meter along the course, excluding measurements where the athletes were in the tucked position. The red line is the ECCDF of the within-athlete lap-to-lap standard deviation. The solid vertical line at 0.0568 N·kg−1 shows the mean standard deviation of Fprop from the Monte Carlo simulation, which reflects the methods typical accuracy under the specified conditions. For comparison, the dotted vertical line at 0.0385 N·kg−1 shows the mean standard deviation of Fprop from another Monte Carlo simulation assuming zero-wind conditions. With the measured wind conditions, inter-athlete SD was greater than the typical measurement accuracy only for 39.1% of the course, and intra-athlete SD only for 11.9% of the course. Under the zero-wind assumption, the inter- and intra-athlete differences were greater than the measurement accuracy for 79.9 and 29.9% of the course, respectively.
