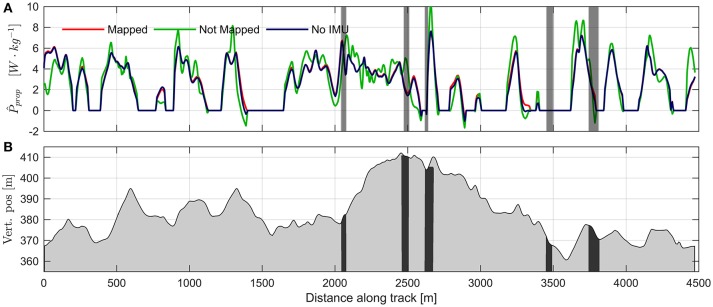
Figure 9.
(A) Comparison of propulsive power calculations using mapping on dGNSS reference (blue line), calculations using only measurements from the standalone GNSS receiver (green line), and using the simplified drag area model based on body mass and skiing speed (Equation 6, red line). Data are from one lap for a single athlete. Vertical gray shading indicates regions where double differenced ambiguities were float. (B) Altitude profile of the competition course. Black regions correspond to the regions where double difference ambiguities were float.

