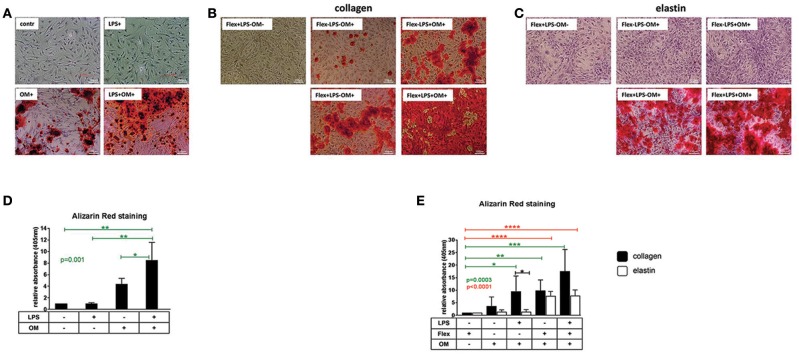
Figure 1.
(A) Visualization of calcium by Alizarin Red staining of valve interstitial cells isolated from healthy aortic valves (n = 3) and cultured on collagen I coating for 14 days in normal control medium (contr), osteogenic medium (OM), control medium supplemented with LPS (LPS+) or osteogenic medium supplemented with LPS (LPS+OM+). × 10. (B,C) Visualization of calcium by Alizarin Red staining of valve interstitial cells isolated from healthy aortic valves (n = 6), cultured on collagen I and elastin coatings and stimulated by stretch alone in control medium (Flex+LPS-OM-), osteogenic medium alone (Flex-LPS-OM+), by LPS (Flex-LPS+OM+) and stretch (Flex+LPS-OM+), or both (Flex+LPS+OM+) in presence of osteogenic medium (OM). × 10. Experiment was performed for 14 days. Flex was applied first 7 days of experiment (2 h per day). (D,E) Alizarin Red staining was quantified by absorbance at 405 nm. Data were normalized to control group (LPS-OM-) (D) or (Flex+LPS-OM-) (E) equated to 1, Differences in gene expression between VICs cultured on collagen and elastin coatings are shown in black stars. The effect of stimulations on gene expression is shown in green stars for collagen and in red stars for elastin. * indicates 0.01 < p ≤ 0.05, ** indicates 0.001 < p ≤ 0.01, *** indicates 0.0001 < p ≤ 0.001, **** indicates p ≤ 0.0001. Overall p-values from one-way ANOVA or non-parametric analysis are shown in green for collagen and in red for elastin. Data presented as mean ± SD. p-values < 0.05 were considered statistically significant.

