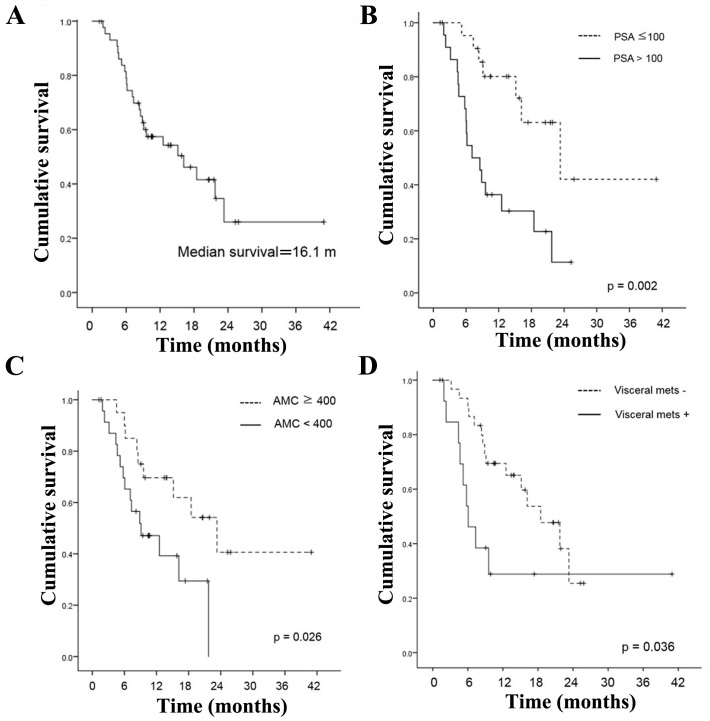
Figure 1.
(A) Kaplan-Meier curve for time to OS in the total population (n=45). (B) Kaplan-Meier curve for time to OS in the PSA specified population (n=45). (C) Kaplan-Meier curve for time to OS in the absolute monocyte count specified population (n=45). (D) Kaplan-Meier curve for time to OS in the visceral metastasis specified population (n=45).

