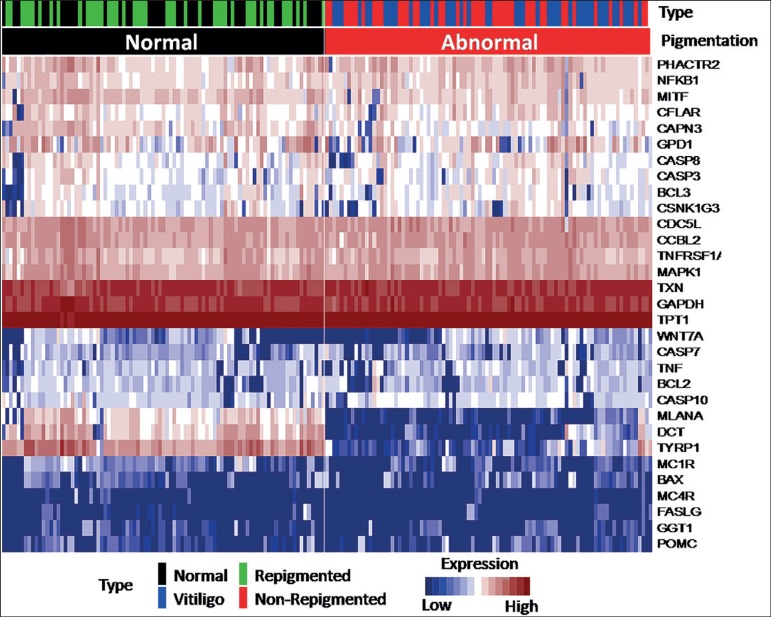
Figure 1.
Heat map of expression patterns from biopsies obtained before and after treatment. In the figure, the vertical axis represents the gene expression patterns of the samples obtained for each gene (horizontal). Sample color codes indicate tissue with vitiligo (blue), unaffected skin (black) before treatment, repigmented skin (green) and vitiligo that did not repigment (red) after nb-UVB treatment. The red coloration within the heat map corresponds to over expression, while white corresponds to intermediate expression, and blue corresponds to sub expression

