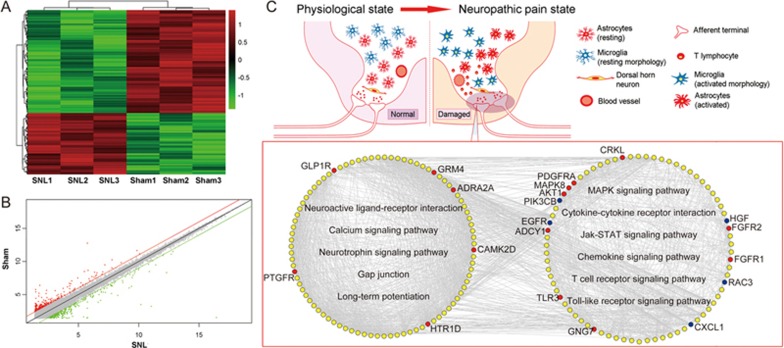
Figure 4.
NP-related genes are implicated in glial cell activation, neuro-immune responses and neuroinflammation. (A) A heat map showing the hierarchical clustering of mRNAs, whose expression changes were changed by more than two-fold in the comparison between the sham group and the SNL group. In the clustering analysis, up- and downregulated genes are colored in red and green, respectively. (B) A scatter plot comparing the global mRNA expression profile in the spinal cord between SNL and sham mice. Red and green lines, respectively, indicate two-fold differences in up- and downregulated genes. (C) The SNL-induced NP imbalance network constructed on the basis of interaction information among SNL differentially expressed genes and known NP-related genes. All nodes were hubs of the SNL-induced NP imbalance network. Red and blue nodes, respectively, refer to the upregulated and downregulated genes in the SNL group compared with the sham group. Yellow nodes refer to the known NP-related genes.

